By Richard Temlett, National Executive Director of Research and Nicolo Traverso, Data & Analytics Manager at Charter Keck Cramer
Housing commentary focuses too heavily on First Home Buyers and Investors. This is because they are easy to measure and politically visible. Charter Keck Cramer research shows that the more important cohort is the Next Time Buyer. These are existing homeowners who re-enter the market to move, resize, relocate, separate, recombine, improve lifestyle, change schools, respond to work flexibility, or trade up/down/across. Next Time Buyers are the engine of housing liquidity and a key lead indicator of supply. They determine how much established stock is released, how prices transmit between suburbs, dwelling types and price bands, and whether the market has enough depth to support sustainable price discovery.
Introduction
Every time the Reserve Bank of Australia changes the cash rate, every time a government announces a First Home Buyer or Investor grant, or every time a new apartment tower gets approved, all the commentary focuses on the same two groups - the Investor (chasing yields) or First Home Buyer (getting on the property ladder).
However, Charter Keck Cramer’s research shows that for the last 20+ years, the cohort that actually drives Australian housing is the Next Time Buyer. The Next Time Buyer is not chasing an opportunity. They are active because buying and selling a home is what a household does when life demands it.
This insight (which is the first in the series) draws on 20+ years of ABS data (loan commitments, building approvals, building commencements, building completions, prices and rents) to empirically prove that Next Time Buyers are not just the largest cohort. They are the transmission mechanism through which monetary policy, supply signals and price pressures propagate across every segment of the housing market.
This has important implications for government seeking to address the housing crisis. For developers and financiers seeking to understand the direction of the various markets and sub-markets. And every day Australians trying to understand what is happening in the housing market and what the government is trying to do about it.
Definitions
There are three main groups of buyers in the Australian housing market. They all have different roles.
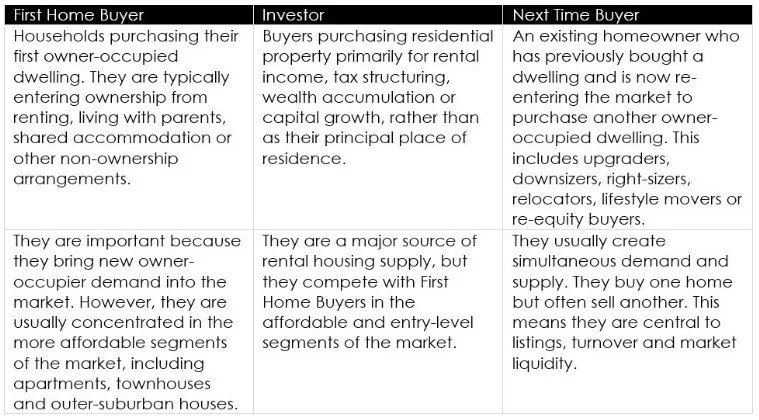
Role of the Next Time Buyer
The first chart in this insight shows the proportion of First Time Buyers, Investors and Next Time Buyers across the Australian housing markets over the last 20+ years.
Since 2004, across every capital city, Next Time Buyers have held between 37.8% and 50.0% of the market (with an average of 44.9%). This is not a recent trend. This has been the structural reality through the GFC, through the APRA lending crackdown, through the COVID stimulus boom, and through the sharpest rate tightening cycle in a generation.
By way of contrast, the First Home Buyer share has swung from 12.8% to 30.6% whilst the Investor share has swung from 20.4% to 44.4%. These have been driven by the introduction and subsequent removal of various incentives for each cohort. As well as rate changes and lending changes aimed at these respective cohorts.
Proportion of Buyers – Australian Capital Cities

Charter Keck Cramer has also analysed the correlation between the various buyer cohorts and the approvals data. The second chart shows the correlation between Next Time Buyer activity and building approvals across the Australian housing markets over the last 20+ years.
The most important finding is that Next Time Buyers are the strongest and most immediate leading indicator of new dwelling approvals, and the effect is concentrated in houses rather than units.
Whilst we have not shared the other charts as part of this insight, the research also showed that First Home Buyers follow rather than lead the cycle. Additionally, First Home Buyer loan growth correlates most with house approvals two quarters later. This suggests their activity is driven more by affordability as well as incentive-driven timing, than by initiating new housing supply.
Finally, the research showed that Investors' relationship with unit approvals was more persistent than with houses. This is consistent with Investors buying into apartment and townhouse projects already in the pipeline, rather than initiating new detached-house approvals.
Next Time Buyers vs Approvals – Australian Capital Cities

Why is this relevant?
When a Next Time Buyer purchases, they often also list and sell their existing home. Put simply, they are critical to market liquidity.
When Next Time Buyers stop moving, the market can become illiquid. This may happen because of high interest rates, mortgage lock-in, stamp duty friction, uncertainty about prices, low confidence, lack of suitable stock to move into, construction delays or simply poor affordability.
By way of contrast, when Next Time Buyers become more active, the market usually experiences higher listing volumes, higher sales volumes, better price discovery, more auction activity, more competition in middle and upper price bands and greater transaction chains across the housing ladder. This can produce a healthier and more liquid market because buyers have more choice and sellers have more confidence.
At present Next Time Buyers have slowed down purchasing activity in many states and territories. The reasons for this do vary between the states and territories but the main factors have been summarised above.
This will translate into lower levels of future supply as well as lower pricing. Both are undesirable. Australia is already falling dramatically behind the Housing Accord dwelling targets, and the analysis suggests this is going to become even more pronounced over the next 12 months. Furthermore, new dwelling prices are linked to established house prices, and Charter Keck Cramer research shows that in many sub-markets established pricing needs to recalibrate upwards before new dwellings can be feasibly delivered to the market.
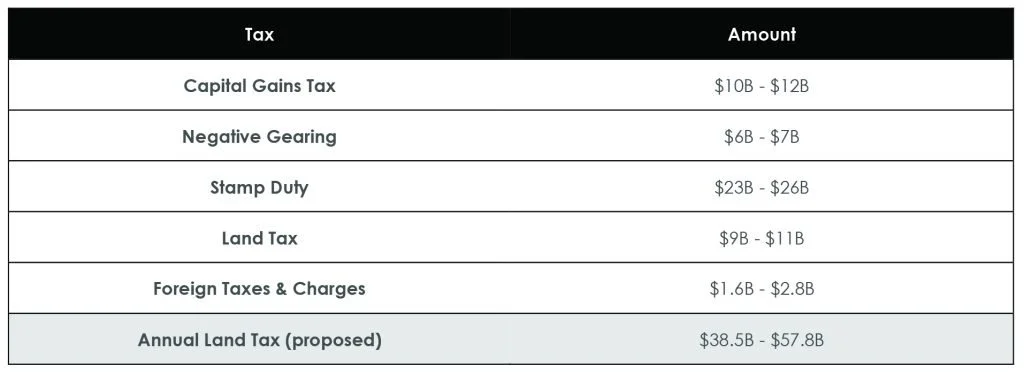
All industry participants need to regularly monitor the Next Time Buyer segment of the housing market. This metric is a critical lead indicator of where the market is heading over the next 6-12 months. For the Federal and State Governments, attention needs to be paid to the various strategies to encourage the Next Time Buyer market to become more active. The number one change would be replacing stamp duty with a broad-based annual land tax. The Federal Government needs to assist the states with this transition as we have argued in previous insights. This is the first step towards improving liquidity, facilitating new pricing discovery, increasing the availability of stock and ultimately helping the market recalibrate.
This article has been republished with permission from Charter Keck Cramer. Read original.