Our cities are making us fat and unhealthy – a ‘healthy location index’ can help us plan better

Dr. Matthew Hobbs is a Senior Lecturer in Public Health and is a Co-Director, while Lukas Marek is a researcher and lecturer in Spatial Data Science. Both Lukas and Matthew are based at the University of Canterbury.

As councils and central government consider what cities of the future will look like, a new tool has been developed to map how various features of where we live influence public health.

The Healthy Location Index (HLI) breaks down healthy and unhealthy elements in cities across New Zealand. It offers important lessons for how we plan and modify our cities to increase physical activity levels and tackle important issues such as obesity and mental health.

The obesogenic environment

New Zealand has one of the highest numbers of adults living with obesity in the world and the rates are not improving. Data from 2021 showed a substantial increase in both childhood and adult obesity from the previous year.

Obesity is a major public health concern that is estimated to be responsible for approximately 5% of all global deaths annually. The global economic impact of obesity is estimated at roughly US$2 trillion or 2.8% of global GDP.

Health issues like this are often thought of in terms of personal responsibility. However, this approach diverts focus away from health systems, governments and physical environments.

The global rise in obesity since 1980 has occurred too rapidly for genetic or biological factors to be its root cause. Instead, it may actually just be a normal response to environments that provide easy access to energy-dense, nutrient-poor foods and a range of unhealthy options that require us expending very little energy.

Think about it: maintaining good health in our current environment requires a lot of effort. Why? Because healthy choices are often more difficult than convenient ones, be that trying to avoid fast-food outlets or conveniently placed liqour stores, the lack of access to fresh fruit and vegetables, or deciding to cycle rather than drive the car.

This is known as an obesogenic environment and it needs to change.


The Healthy Location Index

This change begins with an understanding of how things currently stand, which is where the HLI comes in.

Data used in our index includes quantifying access to five “health-constraining” features: fast-food outlets, takeaway outlets, dairies and convenience stores, alcohol outlets and gaming venues.

We also quantify five “health-promoting” features: green spaces, blue spaces (accessible outdoor water environments), physical activity facilities, fruit and vegetable outlets, and supermarkets.

The index provides a rank for every neighbourhood in New Zealand based on access to these positive and negative features.

Out of New Zealand’s three major urban regions, Wellington shows highly accessible health-promoting and health-constraining environments, Auckland offers relatively balanced environments, and Christchurch shows a high proportion of people living in more health-constraining environments.

Environmental injustice

The bigger picture created by the HLI supports previous evidence highlighting a disproportionate number of features that constrain health, such as fast-food outlets and liqour stores in socioeconomically deprived areas.

Of particular concern in the most deprived areas, the distance to health-constraining features was half what it was in the the least deprived areas, highlighting the persistent over-provision of gambling outlets and liqour stores in some parts of the country.

This phenomenon is well known as a form of “environmental injustice” which ultimately stems from a lack of equity in the development, implementation and enforcement of environmental laws, regulations and policies.

The index also highlights how areas of New Zealand with quick and easy access to health-constraining features are worse off in terms of both mental and physical health outcomes such as depression and type II diabetes.

While the index shows clear evidence that, on average, the most deprived areas of New Zealand often have access to health-constraining features, this finding is not universal. It also varies from place to place.

Wellington and Christchurch both have a decreasing number of health-promoting environments, with growing deprivation. However, there are remarkably more health-constraining places in Christchurch than in Wellington.

Knowledge offers a way to change

This is only our first iteration of the index and we intend to add more features in the future. But we hope the data provided in the index can encourage important conversations to help us better understand how our cities are shaped.

We need to ask whether we really need that additional fast-food outlet or liquor store in the same neighbourhood. We hope the index can help policy makers consider how to shape more health-friendly cities by regulating or adding the right features.

After all, the protection and promotion of public health is a core responsibility of government and it should not be left to individuals, families or communities to create such changes.

This article was originally published on the Conversation. Read it here…

Why Australia’s Reserve Bank won’t hike interest rates just yet

Peter Martin is Business and Economy Editor of The Conversation and a Visiting Fellow at the Crawford School of Public Policy at the Australian National University. A former Commonwealth Treasury official, he has worked as Economics Correspondent for the ABC and as Economics Editor of The Age. He also co-presents The Economists on ABC Radio National.


The biggest question relating to the management of the economy right now has nothing to do with next week’s budget. It has everything to do with the Reserve Bank and the board meetings that will follow it.

The question facing the board – the biggest there is when it comes to how the next few years are going to play out – is whether to hike interest rates just because prices are climbing.

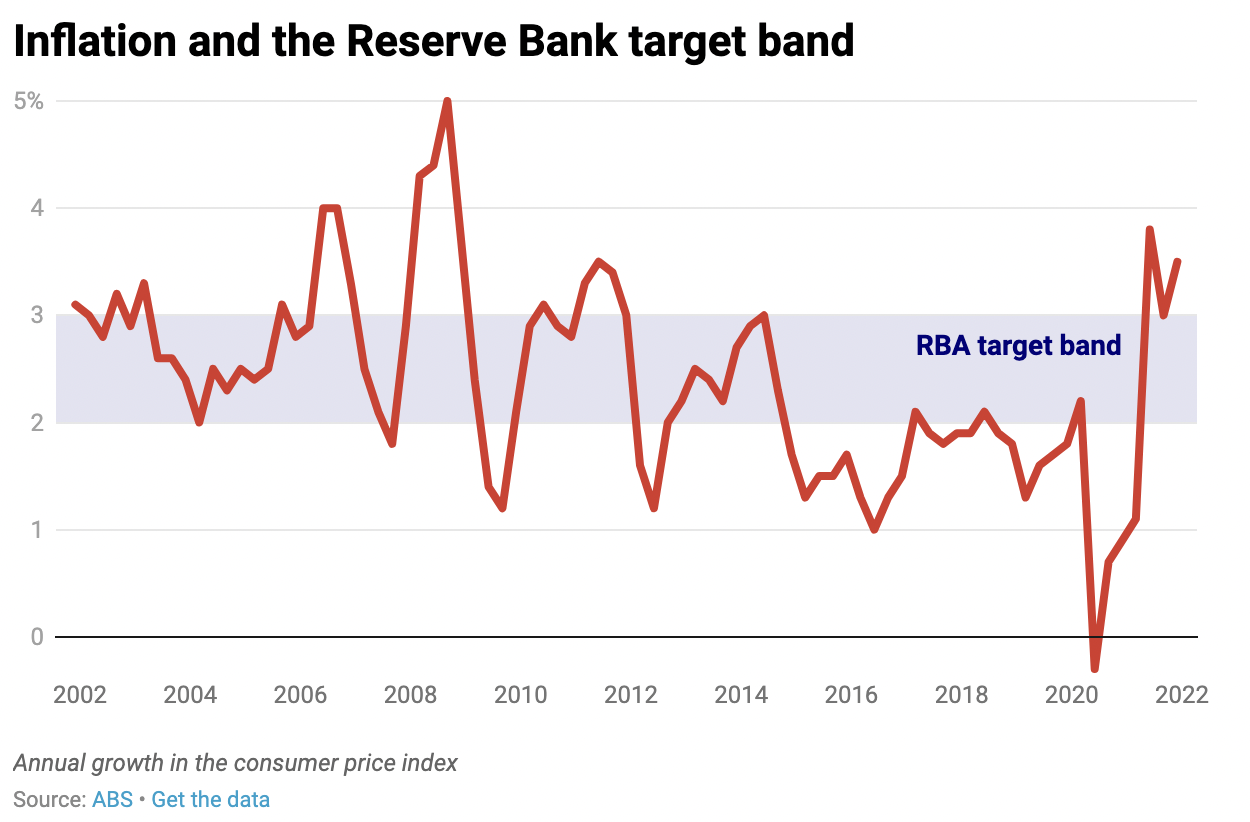
On the face of it, it seems like no question at all. It is widely believed that that’s what the Reserve Bank does, mechanically. When inflation climbs above 3% (it’s currently 3.5%) the board hikes interest rates to bring it back down to somewhere within the bank’s target band of 2-3%.

It’s what it did the last time inflation headed beyond its target zone in 2010.

But the inflation we’ve got this time is different, and failing to recognise that misreads the bank’s rationale for pushing up rates, and what it is likely to do.

Inflation, but not as we’ve known it

The Reserve Bank does indeed target an inflation rate of 2-3%. The target is set down in a formal agreement with the treasurer, renewed each time a new treasurer or governor takes office.

Just about the only tool the bank has to achieve its inflation target is interest rates. If inflation is below the target, it can cut interest rates to make finance easier in the hope the extra money will encourage us to spend more and push up prices.

If inflation is above the target, it can push up rates so it becomes harder to borrow and interest payments become more onerous, taking money out of the economy and giving us less to push up prices with.

Here’s how the bank itself puts it:

If the economy is growing very strongly, demand is very buoyant and that’s pushing up prices, we might need to raise interest rates to slow the economy, to get things back onto an even keel.

Note the qualifier: “if demand is very buoyant and that’s pushing up prices”.

Buoyant demand (spending) is most certainly not the main thing pushing up prices now. The main things are beyond the Reserve Bank’s power to control.

Petrol prices have skyrocketed because of an invasion half a world away. It’s also the reason the global prices of wheat, barley and sunflower oil are climbing.

Food processors such as SPC say higher oil and food prices combined threaten to push up the price of a can of baked beans more than 20%.

The price of a set of tyres is set to climb from A$500 to $750 because tyres are made from oil.

Everything that is shipped and trucked using oil is set to cost more.

And trucks and cars themselves are climbing in price because of a global shortage of computer chips.

And it might get worse. Last week China locked down the high tech hub of Shenzhen, said to be the source of 90% of the world’s electronic goods, among them televisions, air conditioning units and smartphones. It reopened the city this week after testing its 17.5 million residents for COVID.

It’s easy to see why prices have shot up, and easy to see why they might not come down for a while. What is harder to see is how pushing up interest rates to crimp demand, to force Australians to spend less, would do anything to stop it.

What’s missing is inflation psychology

It’s a view Reserve Bank Governor Philip Lowe seems to endorse. He said this month that what he is on the lookout for is “inflation psychology” – the view that price rises will lead to wage rises, which will lead to price rises in an upward spiral.

It used to be how things worked. Australians who are old enough will remember when, if they saw something at a price they liked, they rushed out to buy it before it climbed in price. Australians born more recently have learnt not to bother.


The old psychology could come back, but wages growth – which would have to be high if that sort of thing was to happen – has remained historically low at 2.3%, little more than it was before COVID.

When surveyed, trade union officials expect little more (2.4%) in the year ahead.

It is true that these days most Australians aren’t in trade unions. So the Reserve Bank seeks out the views of ordinary households. On average, those surveyed expect wage growth in the year ahead of just 0.8%, which is next to nothing. The psychology hasn’t taken hold.

Until it does, it is best to think about most of what has happened as a series of isolated externally-driven price rises that have dented our standard of living.

Pushing up interest rates to dent living standards further won’t stop them.

The Reserve Bank is right to be on the lookout for internally-driven, self-sustaining inflation. We will know it when we see it – but we’re not seeing it yet.

Asked on ABC’s 7.30 this week whether there was a role for higher interest rates in an oil crisis, a former Reserve Bank board member, Warwick McKibbon, said

the worst thing a central bank can do in a supply shock or an oil crisis is to target inflation, because by targeting inflation you push downward pressure on the real economy

He went on to say that if the bank did it without success and then kept doing it, it would bring on a recession. I am sure the bank doesn’t want to do that.

Urban makers: why the city of the future needs to be productive

Johannes Novy is a Senior Lecturer in Urban Planning, School of Architecture and Cities at the University of Westminster. He has published widely on urban development politics as well as urban tourism and leisure consumption. He is a founding member of the Sustainable Metropolitan Tourismus Network (SMeT-NET) based at University of Westminster and Paris 1 Sorbonne-Pantheon as well as a member of the Berlin-based urbanist collective u-Lab, Studio für Stadt und Raumprozesse.


How can a city be socially just, environmentally sustainable and economically robust? And what role can urban industry play? These questions underpin IBA27, an ambitious international building exhibition to be held in the Stuttgart region of Germany in 2027. Ahead of that final showcase stage, designers from all over the world are taking part in multiple planning and architectural projects.

In March 2021, the Frankfurt-based architectural practice, JOTT took first place in one of these projects, a competition to design a new neighbourhood in the town of Winnenden, south Germany. Participants were tasked with drawing up plans for what the organisers termed a productive urban quarter.

When completed, visitors to JOTT’s new district will find no cars. Instead there will be an array of work spaces – industrial warehouses, a craftsman’s yard and workshops, offices, shared working spaces, laboratories and studios – built into seven mixed-use, high-density blocks with inner courtyards. Around these will be woven public squares, meadows and playgrounds. The plans also include a childcare facility, retail and leisure uses, flats on upper floors and space for urban agriculture on the roofs of buildings. The whole idea is that people who make things for a living should be able to live and thrive there.

The European Union’s key policy document for sustainable urban development, the New Leipzig Charter, advocates precisely for this kind of city: the productive city. It aims to enable and promote new forms of mixed-use development, that go beyond, say, adding a retail shop at the foot of a block of flats.

Research suggests that manufacturing plays an important role in helping urban economies to thrive. For urban planners, accommodating makers – from small-scale specialty food producers to startup tech entrepreneurs – is increasingly important.

Urban manufacturing

Manufacturing in an urban context has been shown to provide comparatively secure and well-paid jobs. It is important in achieving net-zero carbon targets and transitioning to urban circular economies. It reduces delivery kilometres, promotes the use of more sustainable delivery vehicles such as cargo bikes and encourages local repair and reuse centres to be developed. And, research shows, it makes urban spaces more interesting. Because most city dwellers no longer produce things for a living, many seem to relish the opportunity to see how others do it.

Companies have been quick to latch on. Guinness, for example, recently announced plans to open a brewery in central London near Covent Garden, bringing brewing back to an area where beer was first made 300 years ago.

New developments in cities across the globe, from Rotterdam’s mixed-use Makers District to the Makerhoods in Newark, US, echo this trend. It is fuelled by several factors. New production methods such as 3D printing, have made production less polluting and disruptive. Much manufacturing has also moved away from large-scale production, heavy machinery and massive infrastructure towards smaller, bespoke companies. This makes it easier to reintegrate industry into the urban fabric.

Further, a new generation of urban makers buoyed by the potential of online platforms such as Etsy to sell their wares, has revamped the image of the sector. Consumers, meanwhile, increasingly want local craftsmanship and sustainable, customised products.

Modernist shift

While most cities have been mixed use throughout their history, things changed at the beginning of the 20th century. Modernist urban planning sought to make cities more efficient, rational and hygienic. Concepts including functional segregation and single-use zoning became standard planning doctrines. As a result, most manufacturers were relocated to industrial parks on the outskirts of cities.

If 1960s urbanists came to value diversity in cities as an asset, industry nonetheless continued, quite literally, to be sidelined. Manufacturing was perceived as dirty, dark and dangerous, incompatible with other uses and outdated.

Urban economies shifted away from the production of physical products and towards intangible sources of wealth generation – knowledge industries, culture and services. In New York, blue-collar work and workers began to be portrayed as relics of a bygone era. As a result, manufacturing jobs plummeted from over one million in the 1950s to less than 200,000 in the 2010s.

Reversing industrial decline

The idea of the productive city might currently be popular, but reversing these longstanding processes of industrial decline is not easy. In recent years, the city of Brussels has made a name for itself as a local production hub. And yet, industrial production and employment is still falling.

In London, the situation is similar. Urban manufacturing is increasingly talked about and small-scale and artisanal production are on the rise. However, the sector’s overall contribution to the city’s gross value added and total employment is still far from recovering from its decline of recent decades.


To counter this trend, the revised London Plan – the city’s spatial development strategy – advocates intensifying and densifying existing industrial sites to create additional capacity, as well as mixing them better. While it lacks a citywide strategy to re-industrialise urban spaces, it does suggest stacking uses: allowing flats, say, to be built above industrial space or making rooftops usable for leisure, commerce and green infrastructure.

The UK’s first open-access factory has just opened in north-east London’s Lea Valley with support from Enfield council. This social enterprise, Bloqs, provides 32,000 square feet of workspace and £1.3 million worth of equipment for a wide range of crafts in a converted warehouse. It is part of a multi-billion pound urban regeneration project bringing 10,000 homes and 6,000 jobs to the area.

As with Winnenden’s new neighbourhood, the hope in Enfield is to showcase how urban manufacturing can help a city thrive. But where JOTT’s intervention will be permanent, Bloqs is classified as “meanwhile use”. There is no guarantee the factory will remain a permanent fixture after its current 12-year lease expires. Research suggests that it should: it is precisely the kind of productive space our cities need.


This article was originally written on The Conversation. Read it here…

From a woman in property

Victoria Lindores is an Adviser and Partner at Koda Capital and is a Responsible Investment Advocate. She has nearly 20 years’ experience in the finance and property industries. With an extensive knowledge in responsible and ethical investments, Victoria promotes the power of capital to do good.


To have survived as a woman in a male-dominated profession, I’ve navigated the difficult course between truth telling and “being nice” (and fallen off the cliff more than once!). In recognition of International Women’s Day (IWD) on 8th March, I choose 100% uncomfortable truth.


If you stop reading here, I will not be surprised; nor will I be hurt. You are no different to the many I have met in two decades. The many I have tried to change and failed. You’ll come back if and when you understand that diversity is not some strategic input but a cultural core.

Let’s start with statistics:

  • Less than 25% of Australia’s financial advisers are women.

  • Women represent 55% of the financial and insurances services workforce but has the highest gender pay gap of any group studied by the ABS at 26.1%

  • Only one-third of high school economics students are girls and less than 7% of girls study advanced maths, compared to 12% of boys.

 The UN’s theme for IWD is “Gender equality today for a sustainable tomorrow”


I received an email asking for help to determine who reported to who in my firm. Did I report to Nathan or Brett? A cursory glance at our job titles would have confirmed they reported to me, but such was the swagger / the expectation / the bias.


This is what it is like to be a woman in finance.


Some well-respected property types came to us with a new idea pitched at a boardroom lunch. No handshake, no business card, no introduction for me. Just an unfulfilling apology at the end when they realised, I was the connection to ‘the money’. Time and again, we must prove we have a right to be in the room.


This is what it’s like to be a woman in finance.


There was this great opportunity to talk to a client with millions in a term deposit. They were ready to invest, and my colleague made an introductory phone call. “Yes, Victoria – she’s a good girl.”

How do you recover your professional image after being relegated to a kindergarten student? You work twice as hard.


This is what it’s like to be a woman in finance.


I won’t bore you with further tales of direct discrimination and outright putrid behaviour. That is for champagne over High Tea at the Windsor. But it is these micro-aggressions and the blind cultural acceptance of them (for as a woman you must not be seen to complain!) which reinforce derogatory stereotypes.


Microaggressions corrode confidence, trust and loyalty.

After 20 years in the finance profession, the one thing that still catches me by surprise is how often my opinion is disregarded in favour of a man. This includes men with few relevant qualifications and limited experience. Equality comes in many formats – safety of expression, access to opportunity, speed of advancement, remuneration, to name a few. Too often, a women’s voice starts in the wrong.


As the war for talent rages, more women will seek workplaces where they are celebrated as humans and not simply tolerated as women.


When my gender intersects with my career in conversation, it only attests to what I had to overcome to get where I am today.  Bias against women in the finance profession exists everywhere – in the office, in business, at home, in society, amongst family and friends.


Gender should not overshadow my achievements but amplify them. It does not. Bias assumes that I work less hours, lost several IQ points with every child I birthed and questions my commitment to a career while maintaining that I only got where I am because a smiled a little to become a favoured token.


Let’s look at the data.


Citywire recently released the Alpha Female Report 2021 tracking gender parity in investment roles. They found that mixed gender teams outperformed on risk/return metrics over 3 and 5 years against male or female only teams. They also experienced smaller drawdowns.


Post GFC, mainstream media picked up on studies that linked testosterone and excessive risk taking, and that thanks to their hormones men were more likely to push each other towards brash decisions.


The academic literature is divided as to whether a behavioural difference between men and women in finance can be empirically proven. But a whole heap of popular books try to tell us otherwise; that men are good at systems and women are good at empathy. Risk taking and self-interest aligned to capitalism is seen as intrinsically masculine, at the exclusion of feminine stereotypes.


But what if what the community expects from people in finance is not necessarily what we need? Successive failures of the finance industry to meet community expectations for honesty, trust and care demonstrate that these stereotypes are dangerous, yet capitalist society keeps returning in the belief that they will deliver better outcomes. Why?


HBR found that non-homogenous venture capital teams provided improved financial performance, noting that the earlier diversity is included in strategy the better overall result. More diverse teams broadened the investment opportunity set as it brought in wider networks and alternative worldviews.


What I know, nonetheless, is that my ability, process and worldview come much more from my father than my mother. I’m certainly not more emotional or less rational than my husband. Am I process driven, goals focused, value driven or empathetic? I’m all, and that is what makes a good great financial adviser.


When we allow gender to impact potential and opportunity, we all lose.


No amount of resilience coaching will change the system. The casualties should not be charged with putting it right. The ‘system’ needs to be broken and rebuilt. Espousing meritocracy simply reinforces in-group bias and the halo effect3, and it’s dangerous to your business.


One last personal insight: a word used by men over and over again to describe me is ‘intelligent’. I have always hated it and have never heard it used to describe a man – ever. It is as if intelligence and women come as a surprise so much that it needs to be confirmed. Do you merge a person’s value with their supposed intelligence? And is your perception of their intelligence (and therefore value) related to their likeability and how much they look like you?


Do you tolerate difference, or do you celebrate it?


I don’t have the answers, just lots of questions. And, well, that sounds like the start of a good conversation. It’s time to look at the stories we tell ourselves and ask – Am I biased?


Good decisions cannot be made when one gender is constrained. There is no sustainable future without gender equality.


(Note: This article focuses on gender bias as experienced by me – a white, private school educated, married woman with Australian-born parents. If I were my brother – Andrew – no-one would be asking me to write an article on diversity. I acknowledge this privilege and that bias comes in many forms, including race, culture, postcode, ableism and sexuality.)

Probuild’s collapse is a colossal wake up call to the risks in development and construction

Danny is a co-founder and director of Debuilt Property and has a professional career spanning architecture, construction, project management, development and property finance. Debuilt provides a wide range of consulting services to investors, financiers and developers.


The collapse of Probuild Constructions took many in the property and business community by surprise. In the short time since Probuild appointed administrators much has been written about a ‘broken system’ and the disproportion passing of risk onto builders and ultimately sub-contractors.

The property and development industry is built (pardon the pun) on high leverage and low margin. Developers chase lowest cost (required to make the project stack up) and lenders require fixed (or maximum) price contracts. Builders competitively tender projects on extremely tight margins to win the work and then corral a team of independent businesses (subcontractors) onto a foreign location (building site) to conform to a bespoke design (reams of documentation), an intricate (tight) program; all whilst maintaining a lid on costs.

Our work for financiers and investors focuses on construction due diligence and project monitoring.  It is not uncommon to see projects where the developer’s desire (or need) to squeeze price results in the appointment of a builder without the desired management systems, site team and quality assurance processes. The risks are exacerbated when a developer, after signing up the builder, pays insufficient attention to detailed monitoring, scrutinizing quality systems and subcontractor payments - and linking quality to quantum.

What is unnerving about the failure of Probuild, is that this was a quality Tier 1 builder that would have easily satisfied most developers and financiers. Whilst a credit assessment may have raised concerns, it would have been a tough decision not to appoint Probuild due to a fear that it could not complete.


The following article by James Thomson from the AFR provides valuable reading on this topic.


The collapse of builder Probuild shows how a broken system of contracting has built up in Australia, where too much risk is taken on for too little return.

If you want to understand the collapse of construction giant Probuild, just follow the money.

As Johannesburg-listed parent company, Wilson Bayly Holmes-Ovcon said in its statement announcing it had put Probuild and a group of related companies into administration, raising financial guarantees from lenders to secure new work has become increasingly difficult in recent times.

The construction sector’s system of risk allocation is badly broken. David Rowe

Peter Jeeves, national manager of construction at Lockton, the world’s largest privately-owned insurance brokerage, also says insurers have been pulling back from the construction sector for some time.

“We’ve seen the insurance market appetite and capacity for construction professional indemnity shrink significantly in the last three or four years leading to reduced competition, significantly higher premiums and restrictions in coverage,” he says.

And why has the construction industry’s financial plumbing clogged up? Because this is a sector with too much risk and not nearly enough reward.

Clearly Probuild has been caught in something of a perfect storm caused by the pandemic. As Australian Constructors Association chief executive Jon Davies explains, many of its current projects would be being built under fixed-price contracts signed well before the supply chain disruptions and explosion in labour costs caused by the pandemic.

“We’ve seen significant price escalation in the market and there’s no opportunity to recover that,” Davies says.

‘The system is broken’

Moreover, many contracts will require construction companies to pay liquidated damages if they can’t recover time lost to COVID-19-related delays.

But the problem here is much deeper than a pandemic profitability squeeze, according to Nicola Grayson, CEO of engineering industry lobby group Consult Australia. “The system is broken,” she says.

Whether it is in infrastructure or commercial building, Australia has fallen into a vicious cycle where project owners look to push all the risk in a project onto construction companies, typically through fixed price contracts. The construction firms, facing stiff competition, take on these contracts on extraordinarily slim margins. For example, Lendlease’s target EBITDA margin for its construction division in 2022 is between 2 per cent and 3 per cent.

This margin seems crazy when you consider the risk and complexity involved in a big project. But it’s even crazier when you consider the nature of these take-it-or-leave it contracts that give construction companies few avenues to recoup margin – except, as Grayson points out, by pushing the risk down the line onto project participants such as the engineering firms, which then find themselves taking on outsized risks.

Remarkably, there’s near universal agreement on the solutions: vastly improving scoping of projects, so risks can be properly assessed and priced; a recognition that project owners must share some risks; and a more collaborative approach from all parties.

Davies says it is starting to happen, with governments becoming more cognisant of the need to set contracts up with better risk sharing. He agrees with Grayson that model clients are also needed in the private sector; governments can play a role there too, through their involvement in public private partnerships.

But the construction sector also needs to recognise that the merry-go-round needs to stop.

“We need to shift our mindset away from ‘we’ll fix this problem because we’ll just get that next job that will either tide us over or give us the extra profitability we need’,” Davies says. “We’ve been doing that for too long, which is why the pressure has been building and building.”

Deloitte, which got Virgin flying again in 2020, is now in control of Probuild and intends to keep building sites open while it runs a rigorous and rapid sale process.

Grayson hopes Probuild’s collapse might see the small number of construction firms that have become more selective about taking on uneconomic problems grow. But she doubts the pain is over.

“This has been coming for some time. And, unfortunately, we’re going to see this again, unless some action is taken to balance out the risk allocation,” she says.


This article by James Thomson first appeared in the Australian Financial Review on 25 Feb 2022.

The Architecture of the 2022 Winter Olympics Gets a Gold Medal in Cool

Lisa Wright is a freelance SEO writer and blogger. She enjoys photography, reading, cooking, baking, and British crime dramas and panel shows. Though she generally makes a habit of avoiding social media, you can find Lisa on Twitter @dolphy_jane.


The Beijing 2022 Winter Olympics are officially behind us, but we couldn’t resist giving the games’ stunning architecture a proper send-off. While some of the venues weren’t exactly “new” — the Beijing National Stadium, for example — they still stand out as being some of the most impressive design gems ever to host the global sporting event.

Next time you watch those stunning triple axles and gnarly tricks from the skiers and boarders, take note of the following architectural marvels:

The Beijing National Stadium

Built ahead of the 2008 Beijing Summer Olympics, the Beijing National Stadium (also known as the Bird’s Nest), was conceived by the inventive Swiss architecture studio Herzog & Meuron.

Following the Olympic Committee’s decision to start reusing venues for a more eco-friendly, sustainable approach, the National Stadium has the distinction of being the only stadium to host both winter and summer Olympics. In addition to its unique shape and dynamic design, the Bird’s Nest also just so happens to be the world’s largest steel structure — making it the ideal place to host the opening and closing ceremonies of the 2022 Olympics within its illuminated latticed walls.

National Speed Skating Oval

Designed by architecture studio Populous (themselves no strangers to spectacular stadiums), the National Speed Skating Oval is one of only a few new structures built for the 2022 Winter Olympics.

Built on the former site of the 2008 hockey and archery fields, the Oval’s mind-bendingly melty shape (designed to let the spectators hear even the faintest ice scrape) is certainly distinctive — but it’s the 22 strands of electric blue light circling the stadium that really make it a showstopper. Dubbed “The Ice Ribbon,” the Oval is destined to be one of the highlights of this year’s Winter Games.

Big Air Shougang

Completed in 2019, the rollicking ramp Big Air Shougang marks another new addition to the Beijing Winter Olympics roster. Designed by TeamMinus, the structure is “the world’s first permanent big air structure” and will, not surprisingly, host skiing and snowboarding’s trickiest, most extreme big air events. Set on the site of a former steel mill, the ramp itself has an industrial feel to it, while the colorful aluminum side panels add bravado and flair to the scene.

National Sliding Center

Located in the Yanqing Olympic Zone north of Beijing, the National Sliding Center is yet another new addition to the Winter Olympics’ stellar architectural lineup. Designed by Atelier Li Xinggang, the over one-mile-long sliding track is topped with an impressive tiled wooden roof covering the winding trails below.

The primary site of the bobsledding, skeleton, and luge events at the 2022 Olympic Games, the Sliding Center is the first of its kind in China — and only the third to be built in Asia.

National Ski Jumping Center

Another inventive TeamMinus creation, the National Ski Jumping Center hosted the ski jump and Nordic combined events during the 2022 Winter Olympics. Now, it’s set to become an athlete’s training facility and luxe tourist resort post-games.

Nicknamed “Snow Ruyi” because of its resemblance to a ruyi, a traditional Chinese talisman representing power and good fortune, the center is located in the Zhangjiakou Zone northwest of Beijing — itself already a popular ski destination. Topped with an over 100-foot-high circular viewing platform complete with a panoramic restaurant, the Ski Jumping Center will surely be a destination for years to come due to its fabulous location, stunning vistas, and proximity to a new intercity railway.

While many of the structures at the 2022 Beijing Winter Olympics were repurposed faves from the 2008 Summer Games, we also saw an impressive new lineup of structures built expressly to host this year’s exciting events.

This article was originally published by Dornob. Read it here…

Investment outlook Q&A – inflation, interest rates, Russia & Ukraine, the risk of a share crash, house prices and other issues

Shane Oliver is responsible for AMP Capital’s diversified investment funds and providing economic forecasts and analysis of key variables and issues affecting all asset markets. Shane is a regular media commentator on major economic and investment market issues, and their relationship to the investment cycle.


Introduction

This note covers the main questions investors commonly have regarding the investment outlook in a simple Q&A format.

Is the rise in inflation temporary or permanent?
I suspect it’s a bit of both. Much of the rise in inflation (to a 40 year high in the US and to 3.5%yoy in Australia) can be traced to distortions caused by the pandemic which boosted goods demand and restricted supply (both of goods & workers). Global energy prices are also being boosted by geopolitical tensions (notably in Europe). As consumer demand rebalances back to services, workers return and production catches up to demand, inflation should subside over the next 12 months or so.

However, underlying inflation is unlikely to fall back to pre-pandemic lows and risks running above central banks targets over the next 5-10 years: we are now seeing much easier monetary and fiscal policy & many of the structural forces that drove low inflation look to be going in reverse: globalisation is in retreat; the ratio of workers to consumers is in decline; and we are now seeing bigger more interventionist government.

Will wages growth rise too?
Wages growth has already lifted to 4-5% yoy in the US, depending on the measure. But it has higher inflation and has seen less workers return through the reopening than in Australia. Nevertheless, numerous signs point to faster wages growth in Australia: the jobs market is tight, pushing towards full employment; various business surveys point to rising labour costs; ABS data shows payroll wages accelerating relative to jobs; and there are numerous anecdotes of wage pressure. We expect wages growth to rise to a 3% annual pace by mid-year.

How high will Australian interest rates rise?
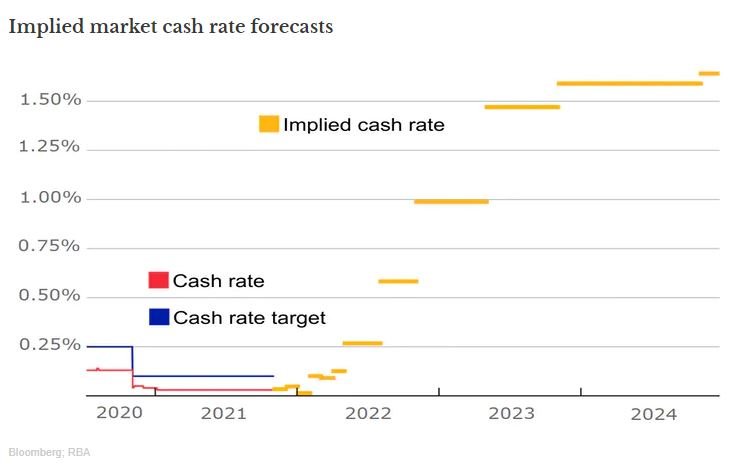
We expect the RBA to start raising the cash rate in August (possibly June) after news of more strong inflation data, unemployment below 4% and wages growth pushing up to 3% and see the cash rate rising to around 1.5 to 2% over the next two years or so. This would add a similar amount to variable mortgage rates. It will take household debt interest payments relative to income back to around 2018 levels. Higher household debt to income levels relative to the past and compared to say, the US, along with falling house prices will allow the RBA to proceed cautiously in raising rates through next year and see rates peak at lower levels compared to the past. Australia also has half the US’s inflation rate.

Will the end of QE & rate hikes be a double whammy?
Not really. Bond buying by central banks (or Quantitative Easing) was an alternative to cutting rates when rates had hit zero. With economic activity recovering and inflation up, it makes sense to end it and begin the withdrawal of the liquidity that was pumped in via QE (ie start quantitative tightening). But central banks can manage this with rate hikes to make sure the overall tightening in monetary conditions is not excessive.

Is coronavirus no longer an economic concern?
Not quite, but nearly. Starting last year each successive covid wave seems to have had progressively less economic impact. This reflects a combination of vaccines, new treatments and recent covid variants being less harmful which has combined to enable reopening to continue. While the risk remains of a new variant which is more harmful, causing a setback, coronavirus could finally be moving from a pandemic to being endemic.

Is the economic recovery on track?
While supply side constraints, monetary tightening, geopolitical threats and covid will constrain global and Australian economic growth, it will still be reasonable at around 4.5% this year. Key drivers are likely to be: ongoing reopening; pent up demand and excess savings; still easy monetary policy; strong business investment; and low inventory levels.

How would a Russian invasion of Ukraine impact investment markets?
Russia has been building up its military presence on the Ukraine border and is demanding that Ukraine never join NATO and NATO not station strategic weapons there. Negotiations have made little progress as the US fears consequences in other parts of the world if NATO does not stand tough. If anything, tensions have worsened as NATO has been shoring up Ukrainian defences and Russia has built up more military assets around it, with the US warning of possible imminent invasion. However, Russia has signalled it will continue with talks. Of course, there is a long history of various crisis events impacting share markets (major events in wars, terrorist attacks, financial crisis, etc) and the pattern is the same – an initial sharp fall followed by a rebound. Based on multiple crisis since 1907 Ned Davis Research found an average decline of 7% in the US share market from such events, but 6 months later the market is up 10% on average and 1 year later its up around 15%. Put very simply, there are four scenarios:

  1. Russia stands down – this would provide a very brief boost for share markets, including Australian shares (eg +1%).

  2. Russia moves in to occupy the Donbas (which is already controlled by Russian separatists) with sanctions from the west but not so onerous that Russia cuts of gas to Europe – this could see a brief hit to markets (say -2-4%) like in the 2014 Ukraine crisis but it would soon be forgotten about.

  3. Russian invasion of all of Ukraine with significant sanctions and Russia stopping gas to Europe (causing a stagflationary shock to Europe & possibly globally as oil prices rise further) but no NATO military involvement – this could see a bigger hit to markets (say -10%) but then recovery over six months.

  4. Invasion of all of Ukraine with significant sanctions, gas supplies cut & NATO military involvement – this could be a large negative for markets (say -15-20%) as war in Europe, albeit on its edge, fully reverses the “peace dividend” of the 1990s. Markets may then take 6-12 months to recover.

Scenario 1 is still possible & it’s hard to see Russia undertaking a full invasion of Ukraine given the huge cost it would incur, let alone NATO troops being involved, but some combination of scenarios 2 and 3 are possible. But the history of such events points to an initial hit to shares, followed by a rebound.

What is the threat posed by global geopolitical tensions – including those with China?
Geopolitical issues have been building since the GFC and seemed to get a push along by the pandemic. The key drivers have been: a populist backlash against economically rationalist policies; the declining relative power of the US; and the polarising impact of social media. The most pressing are those with Russia (see above), China (in relation to Taiwan and trade with Australia) and Iran (in relation to its nuclear ambitions and oil supply). Although hard to time, they all make for a potentially more volatile ride in markets and possibly contribute to a less favourable return environment as they threaten higher inflation and less globalisation. It should be noted though that the economic impact of Australia’s tensions with China has been minor to date as most of the exports impacted were fungible commodities and able to find other markets. The same may apply in relation to iron ore if the adjustment occurs slowly.

Will the Australian Federal election have much impact?
There is a tendency for Australian shares to be somewhat flat in the run up to Federal elections followed by a bounce once it’s over and this is likely to apply this year with the election likely in May. In contrast to the 2019 election where Labor offered a higher tax and higher regulation agenda the policy differences so far appear less significant and if this remains the case the impact on investment markets is likely to be minor.

What is the outlook for Australian home prices?
From their pandemic lows in 2020 Australian dwelling prices are up 25%, but the gains have been slowing since March last year. We expect a further slowing in the months ahead as a result of worsening affordability, already rising fixed mortgage rates and rising variable rates from around August with average prices peaking in the September quarter and then falling into 2024. While prices are likely to rise 3% this year, they are likely to fall -5-10% next year. Top to bottom the fall could be around -10-15%, which would take prices back to the levels of mid last year. Sydney and Melbourne are the most vulnerable to higher rates as they have worse affordability and higher debt to income levels. They are both likely to see house prices peak by mid-year and risk top to bottom price falls of around 15%, whereas other cities and regions may not peak till later this year and have more modest top to bottom price falls.

Will the return of immigrants support home prices?
The return of immigrants this year will provide some support but will unlikely be enough to stop falls given the dominant impact of higher mortgage rates in constraining demand and given the likelihood that the initial return of immigrants will be gradual and won’t offset the net negative immigration of the last two years.

How can we improve housing affordability?
This requires a multifaceted solution across all levels of government with targets to be achieved over say a five-year period. My list of policies to improve affordability includes:

  • Measures to boost new supply - relaxing land use rules, releasing land faster and speeding up approval processes.

  • Matching the level of immigration in a post pandemic world to the ability of the property market to supply housing.

  • Encouraging greater decentralisation – the “work from home” phenomenon shows this is possible, but it should be helped along with appropriate infrastructure and of course measures to boost regional housing supply. Excess CBD office space should be speedily converted to residential.

  • Tax reform to replace stamp duty with land tax (to make it easier for empty nesters to downsize & cutting the upfront burden for first home buyers) & cutting the capital gains tax discount (to end a distortion favouring speculation).

What is the outlook for commercial property?
Commercial property may see weakness in retail and office returns as the influence of the pandemic on online buying and working from home impacts as retail and office leases come up for renewal, but industrial property is likely to be strong.

Should investors invest in Bitcoin and other cryptos?
It’s hard to see Bitcoin becoming digital cash - its transactions are slow and high cost, its highly volatile and it’s a massive user of electricity. It’s not an asset generating cash flows like rent or dividends which makes it very hard to value. And it appears to move in magnified fashion relative to shares, particularly during share market falls making it a poor portfolio diversifier. All of which makes it hard to justify other than as something to speculate on! Of course, this is not to say it can’t go up further as more jump on the bandwagon. Blockchain and distributed ledger technology offer significant potential but it’s hard to separate this from the speculation around crypto currencies.

Will high inflation cause a share market crash?
Shares have had a very strong rebound from their pandemic lows and are vulnerable to higher inflation as it puts upwards pressure on interest rates and downwards pressure on share market valuations (or price to earnings multiples). However, while a crash is always a risk it’s not our base case. First, earnings expectations are still being revised up albeit not as strongly as a year ago. Second, while monetary policy will be tightened its unlikely to become so tight as to cause a recession and slump in earnings. Finally, share markets still offer a strong earnings yield premium relative to bond yields in contrast to in the year 2000 when bond yields rose above earnings yields. Of course, if inflation just continues to surge then the risks to shares will increase.

What are good hedges against higher inflation?
Sustained higher inflation will ultimately mean upwards pressure on the yield structure in the economy which is negative for investments that have benefitted from years of low and falling interest rates, like high PE tech stocks. The best protection against sustained higher inflation would be inflation linked bonds, real assets like commodities and parts of the share market that will see stronger earnings growth.

With bond yields still low why invest in bonds?
Bonds are likely to see another year of negative returns this year reflecting still low starting point yields and capital losses as yields rise. However, they are still a good portfolio diversifier as they are likely to rally if significant concerns arise about a recession.

Building back better: how RBA Governor Lowe sees the year ahead

Dr Isaac Gross is a lecturer in economics at Monash University. He has a DPhil and an MPhil from Oxford University in Economics. From 2011 to 2013 he worked as an economist for the Reserve Bank of Australia.


Reserve Bank Governor Philip Lowe has painted an optimistic view of where the Australian economy is heading after a turbulent 2021.

Just how crazy last year was is highlighted by the differences between the bank’s forecasts at the start of last year and what has actually happened.

Despite the Delta and Omicron waves of COVID, which were unexpected and knocked things around, economic growth has been much higher and unemployment much lower than expected in February 2021.

The bank expected economic growth of 3.5% and might have got 5%. It expected unemployment of 6% and got 4.2%.

It has been a superb economic performance, offset by a higher than expected inflation with a headline rate of 3.5%.

While this looks as if we might be on the road to the high inflation seen in the rest of the developed world (in the US inflation is 7%), at a touch under 2.7% Australia’s so-called underlying rate of inflation is much lower than in the US, UK or New Zealand. It also happens to be in the middle of the bank’s 2-3% target band.

This might be because inflation has been well below the Reserve Bank’s target band for the past half decade.

Underlying inflation


Annual, average of trimmed mean and weighted median. ABS

Addressing the National Press Club on Wednesday, Philip Lowe said he expects Australia’s gross domestic product to continue growing at a rapid rate in the year ahead, around 4.5%. He also sees unemployment to continue falling – down to as little as 3.75% by the end of this year.

He expects underlying inflation to peak at just over 3%, before returning to the 2-3% target band.

Better than before

What explains this optimistic outlook? In many ways, the economy of 2022 resembles a return to normality.

Experts expect the Omicron wave to continue to diminish and the rollout of vaccine boosters and new anti-viral drugs to push COVID into Australia’s rear-view mirror.

This means Australia slowly returning to its pre-pandemic state with open borders and no lockdowns and restrictions.

It would also mean returning to the sub-par economic growth of 2-2.5% we had before COVID, were it not for two things.

One is what the crisis did in forcing the government to end its budget surplus fetish and spend to support the economy.

The other is what it did in persuading the Reserve Bank to rekindle its pursuit of full employment.

Before the pandemic, the bank worried excessively about the risks low interest rates posed to financial stability. Today, it rightly prioritises supporting the labour market.

These twin developments mean the 2022 economy is being supported by two coordinated boosters.

Combined, monetary (interest rate) stimulus and fiscal (budget spending) stimulus has pushed the unemployment rate well below 5% and will continue pushing it down over the months to come.

Dr Lowe finished his speech turning to monetary policy and how it might unfurl over the year to come.

The bank has finished its use of unconventional monetary policies - bond-buying measures such as “yield curve control” and “quantitative easing”. But it remains committed to keeping its cash rate at the current low of 0.1% for a while yet.

So why keep interest rates low?

Why keep interest rates so low if the outlook is so positive? The governor put forward two reasons.

One is that, while the bank has an optimistic outlook for 2022, there is still a great deal of uncertainty around what the year will bring.

The bank wants to make sure these gains are locked in before it takes its foot off the accelerator. The costs of overheating the economy are relatively minor compared to what would happen if it hit the brakes too early and a new variant of COVID tipped the economy back into a recession.

The second is that wage growth remains very weak. The economy won’t be on a stable upward trajectory until wage growth picks up from its historic lows.

Although the bank expects wage growth to lift, it believes it will be a while yet before it climbs above the minimum of 3% needed to keep inflation within the target band.

Australia’s economy survived 2021 better than most expected. On Wednesday, Dr Lowe gave us good reasons to believe that this year it will do better still. And he has committed the bank to supporting households and businesses to try and ensure it does. He wants to deliver on his great expectations.

This article was originally published on the Conversation. Read it here…

John McGrath – Is the Market Cooling?

John McGrath is considered one of the most influential figures in the Australian property industry. As Founder and Executive Director of McGrath Limited, he took McGrath Estate Agents from a lounge room start-up in 1988 to one of Australia’s most successful residential real estate groups, listing McGrath Limited on the Australian Stock Exchange in November 2015.

Australian housing values have been going up at the fastest rate in 30 years, up more than 20% nationally over the past 12 months and up 28% in the strongest market – Hobart, and up 25% in both Sydney and Canberra.

 The market generally remains strong, however the rate of price growth has slowed in recent months. The national median price has gone up by about 1.5% per month consistently since July, compared to the peak monthly growth rate of 2.8% recorded back in March.

That’s not a cooling market. I’d say the market is normalising but there’s still a way to go. Prices are still going up and whilst 1.5% per month doesn’t sound like much, on an annual basis that’s 18% per year, which is very strong growth in anyone’s language.

Auction clearance rates remain very healthy and well above average, despite a high volume of auctions this Spring. In the last week of November, we saw the number of weekly auctions go above 4,000 nationwide for the first time ever, according to CoreLogic data.

 The volume is high right now because lockdown periods have pushed campaigns out, and buyer competition is fierce so more vendors are choosing to sell via auction to capitalise on the extraordinary demand.

On top of that are seasonal factors, with November usually a high volume month as people try to sell before Christmas and the beginning of the new school year.

 The combined capital cities auction clearance rate peaked in October at 83.2% and now it’s about 10-15% lower due to that recent volume surge. A 70%-range clearance is still very strong given 60% is the baseline for normal market conditions. 

The boom market we have seen in 2021 has been mostly fuelled by the historically low official interest rate of just 0.1%. Just 10 years ago, it was 45 times higher at 4.5%.

 It’s entirely inevitable that the market will cool at some point, but it won’t be because of rising interest rates – or the official cash rate, anyway. The Reserve Bank has already told us that won’t be happening any time soon.

It’s more likely that affordability will be the first factor that cools the market down – and it’s already starting to bite. Not only have prices risen by more than 20%, but people’s borrowing capacity has been reduced because APRA has tightened credit criteria and some banks are raising fixed mortgage rates. 

The ratio of housing values to household incomes is also at a new record high in many city and regional areas, according to CoreLogic data.

Put all of that together and affordability will inevitably become an increasingly significant cooling factor over time, resulting in an orderly market correction at some point.

A lack of stock has also driven this year’s strong price gains, however this is also changing. A greater number of homes for sale naturally dilutes buyer competition and this is helping the market to normalise a bit today.

Not only are auction listings rising, but we also saw the highest number of new private treaty capital city listings on record advertised on realestate.com.au in October.

Listings increased by 21.9% in just a month, according to the latest REA Insights Listings Report. The biggest increases were 35% in Melbourne, 30% in Canberra and 26% in Sydney. Brisbane listings increased moderately by 7%.

In the regions, listings increased the most in regional NSW at 14% and regional Victoria at 15%.

There’s a lot of people predicting modest price falls in 2022 and 2023 in the media today. I think it’s inevitable that the market will correct at some point, however predicting the timing of that is hard given we don’t know what the pandemic will bring next.

If you’re looking to buy, you don’t need to worry about whether the market is going to cool tomorrow. Property is a long-term game and you should plan to hold the next asset you buy through at least one or two cycles, which means a couple of growth spurts and a couple of market cool downs at a minimum.

That’s the normal experience for property owners in Australia, so don’t let short-term predictions change your long-term course.

This article was first published on the Real Estate Conversation…

New land tax concessions for Victorian build-to-rent developers

James specialises in property law and advises private, institutional and foreign developers and builders on land and apartment projects. James' deep understanding and experience in residential property development gives him real insight into his clients' needs. He advises on selling and acquiring development sites, ownership structuring, master planned community structuring, property taxes, preparation of master contracts, owners corporation rules and structuring, management rights structuring, establishment of display villages, developer/builder arrangements and managing volume conveyancing.


The Victorian Government recently released the Windfall Gains Tax and State Taxation and Other Acts Further Amendment Bill 2021 (Bill).

The Bill has now passed the Parliament and will go to the Governor for Royal Assent. Amongst other new amendments (including the highly publicised Windfall Gains Tax), the Bill provides for an exemption from absentee owner surcharge land tax and a 50% reduction of the taxable value of land used for an ‘eligible build-to-rent development’ for a period of 30 years. These changes are welcome and will incentivise developers to continue to build on the fast-growing momentum in this emerging sector.

The ‘eligible build-to-rent development’ must satisfy the eligibility requirements for a continuous 15-year period from the occupancy date of the development to access these concessions and if the eligibility requirements cease to be met, a new build-to-rent special land tax will be imposed.

What qualifies as an ‘eligible build-to-rent development’?

Broadly, an ‘eligible build-to-rent development’ is a development project where one or more buildings are constructed or substantially renovated for the purpose of providing at least 50 self-contained dwellings for lease under residential rental agreements where the dwellings are:

  • all fixed on the same parcel of land. A parcel is defined as one or more titles that are contiguous or separated only by a road, railway or other similar areas across or around which movement is reasonably possible and can also include common areas if they are fixed on the same parcel

  • owned by one owner or owned collectively, noting that changes of ownership are permissible during the 30-year term that the concessions are available

  • managed by a single management entity, unless the dwellings are used to provide affordable housing or social housing. The single management entity can be a different entity to the landowner (i.e. the management services can be outsourced)

  • suitable for occupancy on a date that is on or after 1 January 2021 and before 1 January 2032

  • rented, or available for rent, under a residential rental agreement for a fixed term of not less than 3 years (or any other period as agreed between the owner of the dwelling and the renter) and subject only to such restrictions required to ensure public health and safety or to provide social or affordable housing.

The ‘eligible build-to-rent development’ must satisfy the above requirements for a continuous period of at least 15 years from the occupancy date (i.e. the date on which an occupancy permit has been issued in respect of each of the dwellings in the development).

Additional self-contained dwellings can be constructed and added to an existing build-to-rent development after the occupancy date of the existing development and will be taken to form part of the ‘eligible build-to-rent development’. The ‘occupancy date’ for those additional dwellings will be the date on which the occupancy permit for those dwellings is issued and they will need to satisfy the 15-year requirement from that date. This means that an ‘eligible build-to-rent development’ may have more than one occupancy date.

What are the concessions available?

Where a development is an ‘eligible build-to-rent development’, it will be exempt from absentee owner surcharge land tax (AOS) and will receive a 50% reduction in the taxable value of the land used for the development for primary land tax purposes. The concessions apply for a maximum period of 30 years from the date the concessions are first applied to the land.

The exemption from AOS is a welcome change given that, under the existing Treasurer’s guidelines, the AOS exemption for developers undertaking projects like build-to-rent only applied until the development project was completed and AOS would be payable from that point on the basis the developer would be a passive landlord or investor.

The AOS exemption and 50% reduction in the taxable value will result in reduced holding costs for owners of ‘eligible build-to-rent developments’ and increase the financial viability of developing a build-to-rent project.

Build-to-rent special land tax – clawback where eligibility requirements no longer satisfied

Where either of the concessions has been granted but the development project land ceases to comply with the 15-year eligibility requirement (referred to as a ‘change in circumstance’), a build-to-rent special land tax will be imposed.

The owner at the time the ‘change in circumstance’ occurred is liable for this special land tax. Previous owners of the land will not be liable.

The build-to-rent special land tax is effectively a clawback of the concessions previously granted. The rate of tax is 1.275% or 3.275% for absentee owners, and interest will also be imposed.

If the development project land is subdivided and a subdivided lot is sold prior to the 15-year eligibility requirement being satisfied, the build-to-rent special land tax will apply to that subdivided lot.

Key takeaways

The land tax concessions in the Bill for build-to-rent developments show the Victorian Government’s continued commitment to establishing this sector in Victoria and making housing more affordable by increasing the supply of rental properties.

Whilst there are still many challenges facing build-to-rent developers in Victoria, the concessions should act as a lever to further incentivise developers to construct build-to-rent projects and build on the momentum that is already growing.

The concessions broadly align with the concessions already introduced in New South Wales (also a 50% reduction in land value for land tax purposes and an exemption from foreign surcharge land tax for eligible build-to-rent properties that contain at least 50 self-contained dwellings).

Developers will need to carefully monitor that they satisfy the eligibility requirements for a continuous period of at least 15 years otherwise they will be liable for the special land tax. Just one dwelling not satisfying the requirements means the whole project does not satisfy the requirements. Further, the land is no longer eligible for the build-to-rent concessions if the land has previously ceased being eligible for the concessions (i.e. if the requirements aren’t met, the land will not be able to apply the concessions again in the future if the requirements are later satisfied).

The concessions take effect once the Bill receives Royal Assent, which is expected to occur so that the concessions are available for the 2022 land tax year.


This article was originally posted on Maddocks’ website…

Cyber security in real estate a rising threat

Daniel Lepore is the Head of Asset Technology for AMP Capital Real Estate. He is accountable for the business’s strategic technology roadmap, ensuring delivery of value through technology adoption. Daniel is responsible for overseeing a portfolio of initiatives designed to enhance AMP Capital’s Office, Logistics and Retail sectors. Daniel is an accomplished technologist with a passion for delivering innovative solutions that enable sustained, practical outcomes for people, building operations and real estate owners. With over 10 years’ of experience in successfully developing, executing and verifying energy efficiency measures through building automation and performance contracting, Daniel understands the crucial role technology will play in reducing our impact on the climate, sustaining healthy buildings and solving real world problems.

Cyber security is a term usually associated with data breaches such as hackers accessing bank accounts, viruses locking up computers and conflicts between nation-states.

But it is fast becoming a must-know topic for real estate investors.

Modern buildings are adopting increasingly more internet-accessible technologies, which manage the safety, accessibility and thermal comfort of occupants. All of which are intended to do so to enhance sustainability performance and create seamless tenant experiences.

AMP Capital’s Smart Building Platform alone analyses some 385,000 individual data points every 15 minutes, detecting equipment that needs maintenance, whilst Artificial Intelligence (AI) makes pre-emptive control adjustments to air conditioning operations to reduce carbon emissions.

This generates an enormous amount of data that must be stored and managed securely.

And there are the systems which control access to buildings through security gates, send the elevators to the right floors, run the camera monitoring systems, turn the lights on and off – and even monitor life safety that have never been more integrated with one another.

The Australian government has labelled malicious cyber activity one of the most significant threats impacting Australians, saying that in FY20 alone the Australian Cyber Security Centre, the lead agency for cyber security, responded to 2,266 cyber security incidents at a rate of almost six per day.1

The true volume of malicious activity in Australia is likely to be much higher the government supposes, with cyber incidents targeting small, medium and large Australian businesses costing the economy up to $29 billion per year, or 1.9% of Australia’s gross domestic product.2

So how important is cyber security to the real estate industry? And what are landlords doing about it?
Well, the answer is, a lot. Most modern office buildings or shopping centres likely run some 15 to 30 different operational technologies and computer systems side by side3.

Increasingly, these systems operate on common network infrastructure with an ability to be centrally accessed, meaning the applications and data collected are managed over the internet and stored in cloud computing servers.

There are more and more technology enhancements being introduced every day - mobile phones are being used for access control, elevators are controlled by touchless sensors detecting fingers and soon, facial recognition and biometrics will become mainstream, allowing people recognised by the AI systems to walk through security checkpoints without stopping.

The increasing sophistication of the technology means buildings and infrastructure assets have become targets for cyber criminals and so-called state-based actors and it is more important than ever that our real estate assets are properly protected.

Earlier this year, hackers gained entry to the systems of America’s biggest fuel pipeline, shutting it down and demanding a ransom, leading to long lines at petrol stations and higher fuel prices.

In May, the world’s biggest meat processing company was forced to shut workers out of its operations after hackers took control of its systems.5

In real estate, the threat of ransomware cybercrime is growing. Although, one of the main vectors of attack is quite old fashioned – encouraging a worker to click on a link in an email that triggers a malicious download.

For buildings, the problem is heightened because many workers with access to a buildings systems are not educated in dealing with cybercrime. Most buildings have trades, cleaners, contractors and trainees with inside access.

But cybercrime does not have to be just about ransomware. Shopping centres face the simple threat of pranksters getting access to their digital billboards and signage and changing the messaging and videos being displayed causing reputational damage. But cyber criminals can also pose safety issues for people, shutting off access to floors and mischievously changing heating and cooling settings.

To proactively combat cyber-crime and allow the business to set up a safe smart building strategy, AMP Capital has implemented a portfolio wide Operational Technology (OT) cyber security program focusing on three complimentary streams.

  • A standardised remote access solution, enabling safe connectivity between building systems and authorised staff and contractors.

  • Policy guidelines founded on world-leading cyber security standards developed by the US National Institute of Standards and Technology, specifically tailored to building management systems.

  • Uplifting industry awareness through regular training to ensure that those people operating assets are properly educated on cybercrime and digital facilities management, creating a proactive cyber aware culture.

This industry leading program has established the foundations to transform AMP Capital into a globally recognised, innovative, data-insights led organisation, augmented by connecting and collecting data from diverse streams including building technologies that keep occupants safe, secure and comfortable.

People, process and technology must be intrinsically linked to achieve a sustained, long term cyber awareness culture. As Cyber security continues to evolve and change as the industry does, AMP Capital’s vigilance means our buildings can continue to deliver exceptional real estate experiences.
Like much of the rest of our lives, real estate has been eaten by software – buildings today are as reliant on silicon as they are on steel.

Ensuring the safety of tenants and investors from these new threats is at the forefront of a modern landlords’ minds.

1. https://www.homeaffairs.gov.au/cyber-security-subsite/files/cyber-security-strategy-2020.pdf.
2. https://www.homeaffairs.gov.au/cyber-security-subsite/files/cyber-security-strategy-2020.pdf.
3. AMP Capital
4. https://www.bloomberg.com/news/articles/2021-06-04/hackers-breached-colonial-pipeline-using-compromised-password.
5. https://www.bbc.com/news/business-57423008.

This article first appeared on AMP’s blog here…

The upside and downside of regional shift

Andrew Cocks is the owner and Managing Director of Richardson & Wrench (R&W) and a Licenced Real Estate Agent. Prior to joining Richardson & Wrench, Andrew was a Partner with a national Business Advisory group, advising businesses in strategic planning, commercial restructuring, business leadership, franchising and HR / personnel management.


Attend an open home in the regional city of Newcastle and you’ll see a flurry of phones out, Facetime on and the real buyer sitting in a Sydney lounge room, looking to pick up relatively affordable real estate or planning an escape from the big city hustle.

It’s a similar story throughout regional Australia as a century of urbanisation is turned on its head and cities that have for so long been population magnets lose their citizens to the allure of slow living in the bush or by the beach.

The long-term consequences of this demographic shift are yet to play out but in the short-term the impact is already being felt.

And as with any change of this magnitude there are positives and negatives. Let’s start with the upside.

Regional and rural towns are critical to Australia, it’s where much of our export dollars are generated and they offer a balanced lifestyle that the pandemic only served to magnify. But one of the greatest threats to their survival over many years has been the drift of young, bright and productive people to the city. In many small towns the difference between having an adequate allocation of teachers can depend on just a child or two. The population increase in such a town can mean a school remains viable.  

People quickly become an economic generator, bringing new money to a town and benefiting a range of industries, from construction to retail and professional services. Those moving from well-resourced cities also come with higher expectations than regional Australians and their electoral weight could well motivate State Governments to provide more than lip service for essential services in the bush. 

And here we encounter some of the downside of the regional drift, the social and economic impact upon towns that have clung on to their heritage and way of life, the essence of what makes them attractive to sanctuary seeking city dwellers.

Property prices in regional NSW increased 15.5 per cent from January to August this year while regional Queensland experienced 22 per cent price growth, with an accompanying 14 per cent increase in rental prices. That’s a powerful motivation for an investor, providing rental accommodation to local working families, to cash out while the market is running hot. The jobs these local families occupy are the very essential services that keep a town running.

Opportunities to rent elsewhere are slim and in any case rents have soared in tandem with demand and inflated property values. Many of the newcomers to these communities are not working locally but drawing a capital city wage working from home in an industry that requires little more than a laptop, a phone and their knowledge.

When a local teacher, nurse, childcare or retail worker with long-standing ties and commitment to the town can no longer find or afford accommodation, the flirtation with regional living starts to unravel with potential harmful impacts. Increased school attendance generates a need for more teachers but recruitment stalls when those who would take up the opportunity can find no place to live. 

There is every likelihood that many of those who have taken up rural residence are at a stage in their lives and working careers where the opportunity to work from home brought forward plans to scale back or enjoy more of life’s pleasures that the hybrid work model allows.

But it is unlikely that these new residents, who have contributed to pushing property prices to near Sydney levels, will be putting up their hands to take on essential jobs at the local supermarket checkout, mechanical repair shop or bank.

There is a question mark, too, over how long working from home will remain an option. Certainly, many observers believe a hybrid model is here to stay, with workers required to put in an appearance in a CBD office at least two or three days a week. However, the drag of even the occasional commute is likely to drive home the reality that it is difficult to live in two worlds.

Another factor to bear in mind, is that maintaining two homes is not too burdensome while interest rates remain low but the pinch may be felt when the inevitable rise happens or when career progression requires a more visible workplace presence.

Families, too, will face the reality that regional communities have come to accept, that education and career opportunities are far greater in the economic hub of capital cities. And let’s not forget that the bright lights and noise of the city have a more potent appeal to the younger generation than parents who’ve developed a passion for home grown veg.

Tourism plays a major role in the economies of regional towns. Towns impacted by bushfires saw their recovery stall when the first wave of COVID-19 hit in 2020. They came roaring back as Australians satisfied their urge to travel domestically, unable to leave Fortress Australia. But then the Delta wave kept city dwellers locked out, except of course for those seeking real estate in the regions.

Now that international borders are open again, to a degree, the world is our oyster and outbound travel is high on the agenda for many. History shows us that inbound tourists are unlikely to deliver sufficient tourism dollars to support regional towns. As good as it is, most of regional Australia misses out on the Top 10 must-see places for international tourists.

The net loss of tourism dollars will be felt by regional areas and combined with the gradual movement back to the cities, there is a real risk that much of regional Australia will experience a hangover as  the various markets recalibrate over the next few years.

But for those young people priced out of real estate in the big cities, there will remain a strong temptation to shift to where home ownership is still a viable proposition, provided they can retain their city incomes or find alternate work in their new locale.

If this cohort can make the transition to regional centres and put down long term roots, finding local jobs and investing social and financial capital locally, then the rush to the regions may be the best thing to come out of COVID, easing population pressure in the cities and breathing new life into the bush.

RBA says it’s a W-shaped recovery, with housing one of the few concerns

Dr John Hawkins is a graduate of the London School of Economics and the Australian National University. He has worked at the Reserve Bank and the Bank for International Settlements. He is now a senior lecturer in the Canberra School of Politics, Economics and Society at the University of Canberra.


The Reserve Bank has used Friday’s quarterly assessment of the economy to declare that lockdowns have “delayed but not derailed” Australia’s recovery.

It says economic activity probably contracted 2.5% in the three months to September, but the December quarter (the one we are in now) will regain most of what was lost, leaving the economy recovering much as it would have were it not for the mid-year lockdowns.

Taken together with last year’s descent into recession and quick bounce back it paints a picture of a W-shaped recovery, even on what the Bank has graphed as its “downside” scenario.

As a sign of emerging confidence it points to an increase in the number of people prepared to change jobs because they are looking for something better or different.

It says this is partly a bounce back from the start of the COVID recession when workers appeared to put plans they might have had to change jobs on hold.

The Bank is concerned about property markets at home and abroad.

It says the possible collapse of the large and highly leveraged Chinese developer Evergrande might “lead to a significant slowdown in the Chinese economy”.

Average home prices have reached fresh highs in most Australian cities.

It says while interest payments have declined by around one percentage point of disposable income since March 2020 because of lower interest rates, the financial system faces risks associated with high and rising household indebtedness.

While it says mortgage rates will climb, and while financial market pricing implies quite rapid increases in the Bank’s cash rate, it doesn’t expect to lift the rate until 2024 (which is the year after Governor Philip Lowe’s term is due to end, raising the prospect of him completing his seven-year term without once lifting rates).

The Bank has consistently said it will “not increase the cash rate until actual inflation is sustainably within the 2–3% target range”.

It has also said it is not enough for inflation to be merely forecast to be within the range, creating a high bar for action.

Although at 2.1% over the year underlying inflation is the highest it has been since 2015, it is still towards the bottom of the Bank’s target band.

Inflation weaker than it looks

And the rate reflects some temporary factors. Some of it is due to the rebound in petrol prices as demand has picked up as people have returned to work, something that won’t continue.

The Bank expects underlying inflation over the course of 2022 to be 2.25%. Although well above the previous forecast of 1.75%, it is below the mid point of its target.

It doesn’t expect inflation of 2.5% until 2023, suggesting no rate hike until then.

The labour market outlook is little changed from the Bank’s August statement. It expects unemployment to fall to a historic low 4.25% by the end of 2022 and then to 4% in 2023.

Even then, in 2023, it expects only modest wage growth of 3%, doing little to support the sustainably higher inflation it says it would need to see before it lifts rates.

This article was originally published by The Conversation. Read it here…

The State of Play in Construction

Sarah Slattery is the Managing Director of Quantity Surveying firm Slattery. Sarah has more than 30 years’ experience as a QS across Australia and the UK and specialises in costing complex, design-oriented projects, namely in education, arts and culture, health and transport developments. Her expertise has seen her become a trusted advisor to significant government, developer and private clients.


In this update, Slattery provides an overview of the construction market including the volume of work nationally, the pain points across various states, labour and supply chain impacts, and what this means for cost escalation.

The cost escalation forecast and what it means

Slattery is forecasting escalation averaging 4% per annum for the next 3 years with supply chain impacts currently posing the biggest risk to projects. This is mainly due to material costs, and freight and exchange rate fluctuations driving up pricing and pushing out programmes. In this current market, extensive financial due diligence of contractors and their subcontractors is critical. The key is to ensure that contractors and sub-contractors have the suitable financial capacity to deliver projects. As an industry, we need to keep in mind that the closure of State and National borders are limiting the flow of skilled, unskilled, and seasonal migrant workers to Australia. This is creating a major skills shortage across the board which will have flow-on effects now and into 2022.

Disruption through 2020

In 2020, construction productivity decreased across most sectors due to health and safety issues relating to COVID-19 and the various lockdowns across the country causing major disruptions. To add to this, a number of projects had been completed before the pandemic hit and with a slow pipeline of work following behind it, this enforced the reduced activity in most sectors - the few exceptions being logistics, industrial, civil, and infrastructure. Despite the hype and budget commitment, there continued to be limited market activity in the Government space – apart from transport infrastructure. The promised rollouts for social housing, health, and schools took some time to get to market. With low margins and increased competitiveness, Slattery witnessed price reductions across the board – in some circumstances, north of ten subcontractor pricing per trade. The consultant space suffered also with limited opportunities in the market driving down fees. As a result, many companies reduced staff numbers, or at the very least, put a freeze altogether on recruitment. With momentum now building in 2021, we are seeing the market shift.

Volume of Work

The ACIF Construction Forecasting Council Figures on the Value of Work Done [image one], provides an overview of the construction industry. In the residential sector, there has been an uplift in residential building, driven by stimulus and short-term temporary support measures. This is unlikely to be sustained, with the stimulus soon ending, and reduced immigration reducing demand in the medium term. For non-residential building, there has been a sustained decline from the peak in 2020 over the medium term. The forecasts foreshadow a drop in demand for new Offices, Retail, and Entertainment, with Industrial building activity plateauing.

Infrastructure construction is expected to grow by 5% in 2022, as expanded government infrastructure programs fully flow through into activity on the ground. Key areas for growth include rail and electricity supply. Heavy industry including Mining is expected to increase significantly – growing by more than 5% per annum in the next 2 years, driven by expanded activity in coal, gas, and iron ore and newer areas such as hydrogen and lithium-ion. Mining has been the quiet achiever over the pandemic. ACIF reports that the total volume of work of the 4 components mentioned, will peak in the current year, at $243.1B, dipping by 0.7% in 2022 and increasing by 1.9% again in 2023. The type of work is changing, with residential and non-residential being replaced with infrastructure and heavy industry.

Cost Escalation

After a relatively flat 2020, cost escalation is real and needs to be factored into budgets. Some of the drivers behind this are:

Material and supply chain impacts

  • COVID-19 recovery programs intended to stimulate the economy have placed a huge amount of pressure on supply chains not only in Australia but globally

  • We have seen this within Steel, Joinery, Timber, Metalwork, Copper, PVC, Masonry, Reinforcement – just to name a few.

  • COVID-19 outbreaks have led to congestion at major ports, compounding the supply issues and increasing freight costs. Market feedback indicates shipping times from China have increased from 28 to 40 days, and the cost per container has approximately doubled from pre2020 levels. The flow-on for the supply issues are delays to the program, resulting in increased preliminaries costs and loss of income as completion dates push out.

  • Industrial action by the Maritime Union of Australia is impacting ports across Australia, with strike action at Sydney, Melbourne, Brisbane and Fremantle wharves, adding pressure to an already constrained materials supply chain.

  • Another major impact is exchange rate fluctuations for materials supplied from overseas. The AUD was buying just over 57 US cents when COVID-19 hit in March 2020 and increased to a high of almost 80 US cents in February this year, and now back to circa 72 US cents. These fluctuations play havoc with tenders for imported materials, which can make up a large proportion of a tender.

    Example : Steel production and the impact

  • Over the past 12 months, steel production has reduced due to peak carbon emissions and disruption from COVID-19. Some reports say China has reduced steel exports by more than 50%.

    • In Australia, we import at least 30 percent of our steel supply, most of it from China. While both of Australia’s large steel mills have kept their prices relatively competitive compared to the world market – this is changing.

    • Prices for steel from China have also been hit with export taxes and the recent removal of the manufacturer’s tax rebate to compound the supply issues.

  • While Slattery acknowledged some of these material rises last year, tender returns indicated that the full extent of price increases was not being passed on.

  • Now, Slattery is seeing subcontractors and contractors qualifying their tenders for increases moving forward, for example, exchange rates or steel supply. However, projects that were locked in before these increases will be hit hard.

Labour rates and availability

  • The impact of EBAs, although predictable is ongoing with roughly 3-5% Year on Year increases – this automatically guarantees escalation rates of around 2% per annum.

  • The closure of State and National borders are limiting the flow of skilled, unskilled as well as seasonal migrant workers to Australia.

  • Skilled labour shortages in Australia have been an issue for some time with an ageing population and investment in apprenticeships not keeping up with demand e.g. bricklayers.

  • Slattery is seeing contractors using more tier 2 & 3 subcontractors in the current environment to stay competitive, which may have ramifications on solvency and quality

Margins and competitiveness

  • A desire to ride out the pandemic saw sharp declines in tender sums driven by reduced opportunities, resulting in margins as low as 0.5 – 1.0%.

  • Contractors improved competitiveness by reviewing staff salaries, negotiating non-union EBA agreements where possible, and tightening programme durations.

  • Trades were very competitive due to available capacity in the market and tenderers were taking on COVID-19 programme and cost risk.

  • Slattery continues to see competitiveness in the trades and Contractors continue to bid for work outside of their core sectors to fill their order books, but we are seeing margins for both trade and head contractors return to pre-2020 levels

Our Forecast

Slattery is currently forecasting around 4% per annum for the next three years on the mainland. Tasmania is the exception currently with escalation peaking up to 12% in FY2022. This will not be across the board and will affect projects differently. The biggest impact will be on long-term projects. When a budget was set a few years ago and has only recently been given the go-ahead, it is important to review the base price for robustness – it’s not simply a matter of updating for cost escalation.

Risks and mitigation strategies

Contractor selection

Contractors are starting to be more discerning about what they will tender on and good builders will become choosy in this market. Communicating and engaging with the builders to make sure they are interested first is key. Minimise project risks before-hand and make the tender package as attractive as possible.

Procurement selection

Clients are moving away from ECI procurement unless there is significant programme drive. While Slattery notes cost escalation impacts - contractors still need to fill their order books and on the back of a poor 2020 – will still be competitive.

Contractor and subcontractor performance

In this market, extensive financial due diligence of contractors and their sub-contractors is critical to ensure they have the suitable financial capacity to deliver projects. A major risk is insolvency. This is enhanced currently with low margins and changes to trade market pricing on projects locked in last year.

State by State Focus - Common Trends

Many impacts are common nationally, however each state is facing its own local impacts, opportunities and challenges. To read a state by state focus, access Slattery’s full report here…

Melbourne MarketBeat Report: Office Q2 2021

John Sears leads Cushman & Wakefield’s Research team in Australia and New Zealand. John and his team are responsible for driving research, insights, and thought leadership to support the growth of Cushman & Wakefield in Australia and New Zealand. John and his team also help clients with market data and analysis to help them identify suitable investment opportunities. Prior to starting at Cushman & Wakefield, John was head of research at Vicinity Centres.


Economic Overview

The COVD-19 pandemic caused a short sharp recession in Australia during Q1 and Q2 2020. Data to March 2021 indicates the Australian economy returned to growth in Q3, rising 3.4% over that quarter with a 3.2% increase in Q4 and a 1.8% increase in Q1 2021.

Demand in Victoria did not follow the same trend, due to the lockdown restrictions in place. Assuming the pandemic is contained globally, both Victoria’s and Australia’s economic growth rates are expected to remain positive over the forecast horizon with relatively strong growth expected over the next few years. Deloitte Access Economics forecast real gross state product (GSP) to increase by 6.3% over calendar 2021 and 3.5% in 2022 and 3.2% in 2023. Over the past 10 years, Victoria GSP annual growth has averaged 2.0%.

Melbourne CBD

Supply and Demand

After 351,900sqm of stock was added in 2020 and 65,500sqm was withdrawn, the first six months of 2021 saw a mere 13,200sqm added and 13,500sqm withdrawn. A further 157,400sqm of new and refurbished space is due for completion in 2021, of which over 66% is pre-committed. A further 185,900sqm is due for delivery in 2022 though some of this supply may be delayed.

In terms of current and future demand, business confidence is strong and smaller, local businesses are making decisions on three and five-year terms. Larger tenants are slower to commit with many opting for short term extensions. Workers return to the office has been kept to a maximum of 25% by Government decree. The rollout of the vaccine over the final quarter of 2021 can be expected to see the lockdown end and a return to higher levels of occupancy in 2022.

Rents

Net incentives stabilised in Q3 2021 and are expected to remain at these levels for the remainder of the year before falling as the recovery gathers pace in 2022 and workers return to the CBD.

Premium grade net incentives are 39%. The average A grade net incentives were stable at 41%. Currently, B grade net incentives are 38%.

Premium grade net face rents were up slightly over the quarter to average $695/sqm, A grade were also up slightly and average $635/sqm. There was also a slight rise in B grade net face rents with rents averaging $530/sqm.

Metro Melbourne

Supply and Demand

2020 saw eight metro office projects reach completion, delivering 128,000sqm of floor space to market. Looking forward there is some uncertainty around the medium and longer term pipeline with COVID creating disruption and uncertainty around the delivery of projects. Nevertheless, there are ten projects being completed in 2021, delivering over 140,000sqm of new space to the fringe office market and well over half is pre-committed.

In terms of current and future demand, business confidence is strong and smaller, local businesses are making decisions on 3 and 5 year terms. The rollout of the vaccine over coming quarters can be expected to see an acceleration of business commitment.

Rents

Despite the turbulent year across the city, the metro markets net face rents have remained relatively stable over 2020 and 2021. Upward movement in net incentives has placed downward pressure on net effective rents, with Southbank recording a 9.3% year on year (YoY) fall to reach $362/sqm. For St Kilda Road it is a similar story with net effective rents dropping 14% YoY to reach $284/sqm. It is expected that incentive increases have now run their course, helping to stabilise net effective rents across Metro Melbourne.

The strong underlying trends making retail property an attractive investment

Richard Germain is a Managing Director at MA Financial Group. Richard helps manage and grow the Real Estate Asset Management business which includes sourcing appropriate fund investments and investment capital, both institutional and high net worth and the establishment and investment management of real estate funds and assets. Richard was previously an investment advisor and portfolio manager at Lend Lease Corporation Limited including providing portfolio management, product design, and advice to the company’s funds on appropriate investment.


Real estate has proved to be one of the most resilient and best risk adjusted performing investment classes in Australia since the early 1900’s.

Retail real estate in particular offers investors an attractive counter-cyclical investment opportunity, underpinned by a range of strong underlying trends.

Long history of consistent and resilient retail sales growth

The sector has been underpinned by a long history of consistent, resilient and solid growth in retail sales.

Over the past five decades or more, the Australian Bureau of Statistics have not recorded a single year of negative retail expenditure growth – including during periods of economic uncertainly.

In the 12 months to December 2020 retail expenditure grew 10% despite significant COVID-19 related disruptions. During the global financial crisis retail expenditure grew on average 12% p.a. between 2007-2009, despite increasing unemployment and sharp corrections in equities markets.

People and food the key drivers

Australia’s high population growth has been a catalyst for this increase, and has supported non-discretionary retail categories such as food in particular.

Since 1982, ‘Total Food Retailing’ and ‘Total Cafes, Restaurants and Other Takeaway Food’ have delivered the highest average annual growth rates of 6.3% and 6.6% p.a., respectively.1

Australian shopping centres, anchored by national supermarket retailers such as Coles and Woolworths, account for a significant portion of total retail sales.

Low supply, high barriers to entry

The Australian retail market exhibits very different characteristics to other retail markets around the world, in large part due to the high barriers to entry but also comparative low supply versus the major markets of North America.

Less than half the supply of the US

Australia has retail supply of approximately 1.06sqm per person compared to the US which has more than double this.

Retail space provision - Australia vs United States

Restrictive zoning regulations

In Australia, the supply of new retail floorspace per additional person has been decreasing – from 2.6sqm p.a. in 1995-1999 to 1.1sqm p.a. between 2015-2019.

This reduction can be attributed to the fact the supply of new retail floorspace in Australia is tightly controlled by restrictive zoning regulations, and our high population growth has led to greater emphasis on residential planning schemes.

This restricts the ability to develop new retail shopping centres in established metropolitan areas, meaning new retail supply is often introduced into high residential growth areas along the metropolitan periphery which has no material long-term impact on established shopping centres.

High occupancy rates, diversified tenant base

Occupancy rates for Australian retail assets are high, with a national average vacancy rate of only 6.9% and a 10-year average of 4.2%.2

Retail assets are assisted by the diversity of their tenant base. While Australian shopping centres are generally anchored by the major supermarkets and often discount department stores, the sub-regional and regional centres also have a diverse range of smaller tenants reducing the exposure to any individual tenant.

Strong and resilient Australian economy

The strength in the retail sector is supported by a strong and resilient Australian economy.

Until the exceptional circumstances brought on by COVID-19 in 2020, Australia had not experienced a recession since 1991.

The economy has been driven by strong population growth, increasing productivity and access to in-demand natural resources. It remains a highly desirable destination due to our favourable standards of living, including a top tier medical system, stable governance and strong agricultural production.

The sector is well positioned to continue on an upward growth trajectory and is increasingly being sought by institutional investors.

This article was originally published by M A Financial. Read it here…

Making sense of macro-prudential changes

eliza_owen.jpeg

Eliza Owen is the Head of Residential Research Australia at CoreLogic. She has a wealth of experience in property data analysis and reporting. Eliza worked as an economist at Residex, a research analyst at Domain Group. She specialises in descriptive and inferential data analysis, data visualisation and framing data trends with broader economic concepts.


This article was originally published by CoreLogic. Read it here…

The past few weeks have seen mounting speculation around what changes could be coming for the housing lending space. The Council of Financial Regulators, which includes the banking regulator APRA, flagged the need for sound lending standards to be maintained, with signs of “some increased risk taking” appearing in mortgage lending.

Examples of a more risky debt and lending environment have been trickling through various data releases over the past few months. RBA data shows housing debt-to-income ratios reached record highs for owner occupiers at 102%, annual housing credit growth (5.6%) is outstripping income growth (1.6%), and APRA data shows a higher than usual concentration of new loans on high debt-to-income ratios.

It became increasingly clear that ‘macro-prudential’ intervention (policies aimed at securing financial stability) was a case of ‘when’, not ‘if’.

Wednesday’s announcement from APRA outlined changes to the way lenders assess new borrower’s ability to service a mortgage. Essentially, banks would be expected to test whether a borrower could repay a mortgage, if the mortgage rate is three percentage points higher than the product rate on offer. APRA advised the buffer should be implemented by the end of October 2021.

Importantly, major banks already have a required buffer of 2.5 percentage points in the serviceability assessment process, which was introduced in 2019, or a minimum interest rate level to assess serviceability (also known as a ‘floor’ rate), which averaged 5.09% across the major banks in June. This includes a proactive increase to the floor rate of 15 basis points from CBA in June. Banks must use whichever rate is higher to assess serviceability, which plays in to the subtle targeting of this new recommendation from APRA.

Because owner occupier mortgage rates are lower than investor rates, these changes may actually have more impact on the investment segment of the market. Additionally, as APRA notes in their announcement, investors tend to be more leveraged in their borrowing behaviour and may be carrying additional housing debt which would also be subject to the increased serviceability assessment.

Figure 1 compares the change to interest rate assessment based on the current average mortgage rate for new owner occupier loans (which was 2.36% through August) and investor loans (2.72%).

Using the average owner occupier rate as an example, APRA’s announcement would mean borrowers could need to demonstrate the ability to repay a mortgage with an interest rate of 5.36%. But given floor serviceability rates would have been pretty close to these levels anyway, the measure is not as drastic a change for owner occupiers, with the hypothetical showing an increase in assessment rates of 27 basis points from 5.09%, to 5.36%. This is opposed to a 50 basis point rise for investors. Owner occupier borrowers may be more likely to be assessed on the buffer rate under these changes, rather than the floor rate.

Figure 1. How does serviceability assessment change for owner occupiers and investors?

Figure 1. How does serviceability assessment change for owner occupiers and investors?

But even in this scenario, the mortgage rate buffer going from 2.5 to 3.0 percentage points seems like a subtle approach to financial stability and will likely only impact at the margins of borrowing demand.

Perhaps this is also a lesson learned from the relative shock created to the housing market in 2017, when new interest only mortgages were limited to 30% of new housing lending. A chart of monthly housing market movements across Sydney against previous macro-prudential measures can be seen in Figure 2.

Housing market values experienced a peak to trough decline of -8.4% off the back of macro-prudential changes in 2017 at the national level. The decline was sharper across heavily concentrated investment markets like Sydney (-14.9%) and Melbourne (-14.1%). This subtler change to lending conditions is far less likely to move the housing market into negative territory, and APRA estimates the typical maximum borrowing capacity would only be reduced by about 5%.

Figure 2. Month-on-month change in dwelling values, Sydney

Figure 2. Month-on-month change in dwelling values, Sydney

More to come? 

While APRA’s announcement may seem like it won’t have much impact on demand for credit, it is worth noting that this may not be the end of macro-prudential changes. A lot of focus has also been on high ‘debt-to-income’ ratios – a statistic expressing a borrower’s pre-tax income divided by their total debt levels. 

In his letter to lenders, APRA Chair Wayne Byres flagged that if new mortgage lending on high debt-to-income ratios remained at high levels, it “would consider the need for further macro-prudential measures”. It has also been stated by the regulator that implementing a limit on high debt-to-income ratios is “operationally complex”.  

Therefore, while the announcement may seem like a subtle change to housing lending conditions, there may be more tightening to come as the Council of Financial Regulators monitors trends in housing credit and household debt.

The quiet tech revolution delivering ground-breaking results for real estate

capital.img.720.0.jpg

Daniel Lepore is the Head of Asset Technology for AMP Capital Real Estate. He is responsible for overseeing a portfolio of initiatives designed to enhance AMP Capital’s Office, Logistics and Retail sectors, including: cyber security risk and potential impacts to data and physical assets; successfully establishing the foundations for sophisticated smart building applications; use of data analytics and artificial intelligence to generate meaningful actionable insights; organisational enablement and readiness for technology change, channelled through centralised support; and enhanced customer experience through a shift in workplace and retail expectations.


In the decade since Netscape founder Marc Andreesen said software would eat the world, the statement has become somewhat of a truism in most aspects of our daily lives. The real estate industry is no exception.

Buildings that were once solely attended by a team of human security, maintenance and cleaning staff are now leveraging sophisticated artificial intelligence (AI) applications and sensors to help streamline their operations.

It has been somewhat of a quiet revolution, but the roll-out of software and AI systems into the real estate industry is delivering ground-breaking results for landlords, investors and tenants – and changing the way real estate is managed.

Improving ESG a key driver of change

One of the key drivers of change has been a desire from investors and tenants alike to improve their buildings’ sustainability on a range of environmental, social and governance measures – most notably through reducing real estate’s carbon footprint and energy usage.

Traditionally, reducing the carbon impact of a building has been a manual affair – lowering the air conditioning, turning off the lights after closing time, encouraging recycling and ensuring space is being used efficiently.

But modern buildings are deploying new AI technology to supplant and improve the role that conventional automation and facilities management once played. Autonomous heating, ventilation and air-conditioning (HVAC) controls are a leading example.

Autonomous HVAC technology a first for commercial real estate

Heating, ventilation and air-conditioning are among a building’s largest operational contributors to greenhouse gas emissions.

Using sensors, data analytics and machine learning algorithms to manage heating and cooling, autonomous HVAC systems offer the twin benefits of reducing energy usage while delivering better comfort outcomes for occupants.

AMP Capital is the first commercial real estate manager to deploy autonomous HVAC control across its entire portfolio – and the early results are outstanding, showing up to a 17 per cent reduction in base building energy consumption and costs.

This result comes primarily from the fact that the heating and cooling systems run approximately 40 per cent fewer hours when managed by autonomous systems than they do when conventional automation is in charge.

Even so, the thermal comfort levels of building occupants – measured by how a room’s temperature meets the desired set point – are 30 per cent better.

How is the software achieving this? Essentially by studying how a building operates and analysing the external factors impacting it such as weather, wind, sunshine and occupancy.

In fact, AMP Capital’s Smart Building Platform captures over 365,000 sensor data points every 15 minutes, while the HVAC software pre-emptively adjusts temperature and airflow every five minutes.4

And it’s not just environmental performance where software is supporting the property industry. The data collected is also used to predict, detect and request maintenance.

This ‘data-driven’ maintenance is already paying dividends for investors, reducing maintenance cost and promising to extend the life of equipment.

AMP Capital deployed the system earlier this year in 35 major buildings including 33 Alfred St and the Mascot Corporate Connect Centre in Sydney and Bourke Place in Melbourne.

So far, more than 700 maintenance tasks have been escalated to site teams by the automated systems, which are constantly watching for events as simple as a stuck air conditioning valve that would likely go undetected by traditional building maintenance systems.

Promising results in early trials of cleaning innovation

Technology is also taking on one of the most human tasks of all – cleaning. Cleaning innovation is at an earlier stage than energy and maintenance management, but it is showing promising results.

At Melbourne’s Collins Place, a network of Internet of Things (IoT) sensors and robots have been deployed to improve end of trip facilities and common area cleaning practices through autonomous vacuuming, sweeping, mopping and disinfecting – and freeing up human cleaners to focus on high touch areas to support the health and safety of our customers and visitors.

The robots even politely interact with visitors, entertaining their human guests while they go about their work. But there’s a serious side to it too. Not only does robotic cleaning free up humans for more important work, but the robots use 80 times less water than a manual cleaner.

The rapid deployment of technology across real estate is coming with an even better outcome for investors – it’s essentially paying for itself.

Reduced energy usage delivers immediate cost savings for tenants and landlords and vendors of the AI systems are paid only if they deliver on promised outcomes and savings.

Advanced Automation proving successful

At Stud Park shopping centre in Melbourne’s Rowville, automated systems have delivered a 16 per cent reduction in base building energy usage. In Sydney, at 33 Alfred St – one of Australia’s oldest skyscrapers – heating and cooling systems run 15 per cent fewer hours and thermal comfort is up 50 per cent.

At the Mascot Connect Corporate Centre development that includes office buildings and ground floor retail, HVAC is running 20 per cent less with a 30 per cent increase in comfort.

Beyond energy costs, automated systems also reduce the costs of maintaining and repairing expensive capital equipment by catching small problems before they become big ones.
It’s early days, but this should help building owners extend the life of some of their equipment.
If a HVAC system is running 20 per cent fewer hours, it can reasonably be expected to operate beyond its former useful lifetime.

So, what’s next for building tech?

Arguably, we are only at the beginning of a great transformation for the real estate industry that will deliver benefits for investors, landlords, tenants – and the planet.

Already, developers are working on using augmented reality to help people find their way around buildings using their mobile phones. It’s also possible for phones to replace the smart cards we use for building entry.

But soon, facial recognition will allow tenants to breeze through security gates while sensor monitoring networks will watch building usage in real time, proving tenants with data on where people are gathering, why some meeting rooms are more used than others and how shopping centres can get better traffic to the little used corners.

All of this will be run by integrated network operations centres watching and managing multiple buildings, delivering better experiences for tenants and guests – and better outcomes for landlords and investors.

This article was originally published by AMP Capital here.

Is there a new lease of life for former aged care facilities?

Marcello_CaspaniMuto.jpeg

Marcello Caspani-Muto is a Senior Negotiator - Healthcare & Social Infrastructure at CBRE. He is a qualified, experienced and award winning agent who has established himself as an expert across all healthcare and social infrastructure markets. He joined CBRE in 2017 as an Analyst and in 2020 was recognised with the prestigious industry award, REIV Outstanding Young Agent of the Year. Enthusiastic and driven, Marcello has an expansive skill set and market knowledge that allows him to establish strong client relationships and achieve premium results for clients.


What’s next for Australia’s aged care services market after 18 months of forecast change? Taking centre stage are new mixed-use health and wellbeing precincts as former aged care facilities get a new lease of life.

These vacant aged care homes are presenting opportunities for alternate use operators including rehabilitation, Specialty Disability Accommodation, National Disability Insurance Scheme providers, medical centre, consulting suite operators and mental health and wellbeing services, as the country continues to embrace the challenges of continued and longer lock-downs and a rise in mental health concerns.

Key players in the market include syndicates of doctors and specialists with stakes in their businesses, who are unlocking the value in former homes by repurposing them into precincts that bring together like-minded tenants offering complementary and specialised health-related services.

These groups are targeting existing premises that meet their requirements and offer access to short stay accommodation and rehabilitation facilities that are compliant or offer the capacity to be repurposed as such and often have high-quality existing fit outs and standards that would otherwise be unattainable.

Buying and converting these existing facilities also comes at a much lower cost than undertaking a new development.

Table.jpeg

For example, a 15-year-old, 75-bed aged care home in Northcote recently hit the market with a $9 million plus price tag via CBRE. To build this same facility today would cost above $15 million, so you can see why smaller health services groups are attracted to these sites and are capitalising on their existing infrastructure.

Another example involves the former Wakefield Hospital and adjoining Wakefield Clinic in Adelaide. This facility was recently sold, and the existing spaces are being marketed for lease, with the former emergency department now positioned as a healthcare hub within a vibrant mixed-use precinct that will include numerous medical centres, specialists, and hospital/rehabilitation users together with retail childcare and aged care groups.

Investors considering these health-related property investments need to be savvy and highly competent as the healthcare market is highly specialised and has strong barriers to entry.

For instance, if investors are considering purchasing an established aged care home and continuing with its existing use, the age of the facility and its maintenance history are critical factors.

In most cases, experienced residential aged care operators adhere to a strict maintenance and refurbishment schedule, particularly for homes located in metropolitan areas. This is primarily for residential quality of life; however, it also ties in with the ability to secure higher levels of government funding.

Set against this are the substantial construction costs to build a new aged care facility, which can range anywhere from $200,000 per bed to north of $350,000 (subject to quality), which is why purchasing an existing site can be appealing.

So, to conclude, there are major opportunities in the aged care and health services property sector. As outlined above, it’s an evolving, dynamic sector, but it’s also important to consider all the factors at play as you make your investment decisions.


This article was originally published on CBRE’s website. Read it here…