
By Oliver Nichols, Director of RLB in New South Wales and Trent Wiltshire, Chief Economist - Oceania, RLB
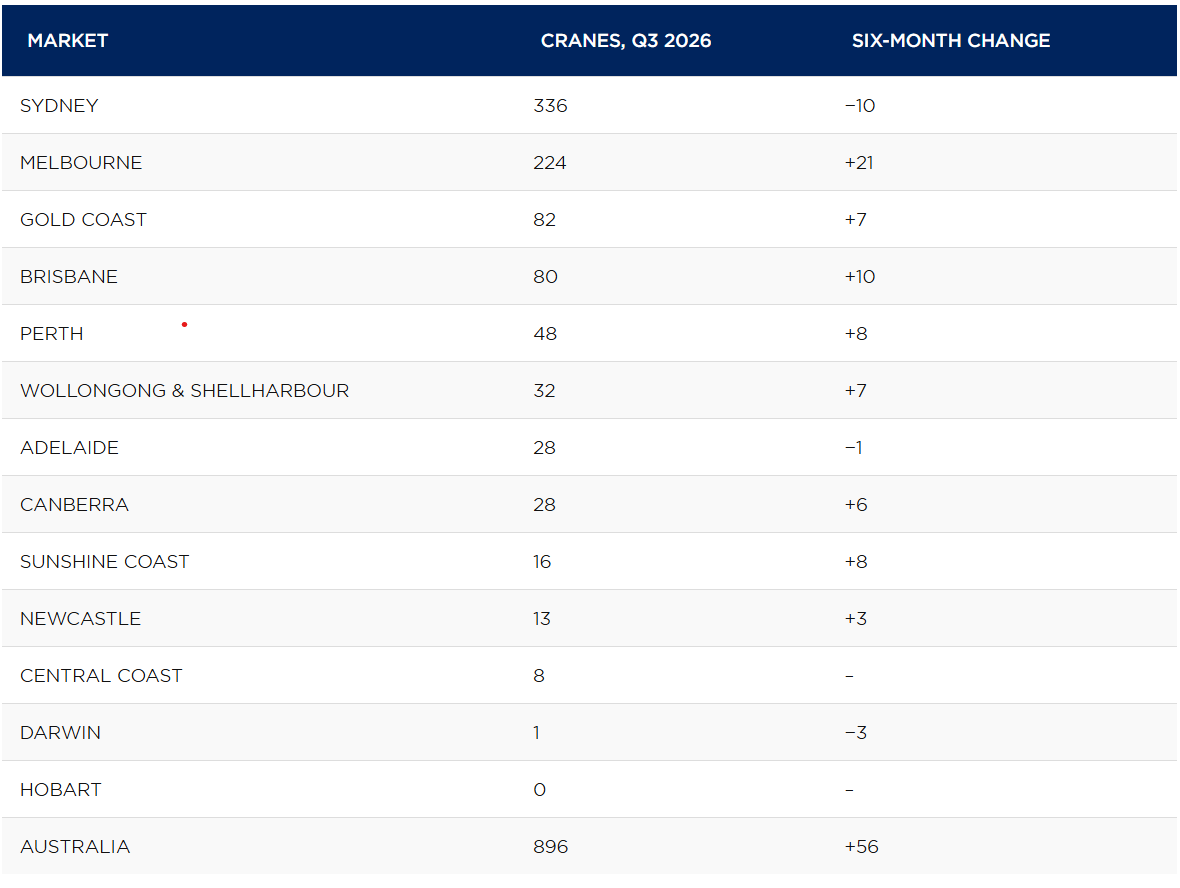
The Q3 2026 RLB Crane Index® shows 896 cranes nationwide, the most ever recorded. Melbourne and the Gold Coast are at record highs, while Sydney continues to ease.
Australia’s construction skyline has reached a new high. The 29th edition of the RLB Crane Index® recorded 896 cranes across the country’s major centres in Q3 2026, pushing the national index to a record 210 points. Behind that headline, though, is a market moving at different speeds. Growth is being driven by Melbourne and South-East Queensland, spreading into a number of mid-sized markets, and offset by a continued softening in Sydney.
“The latest RLB Crane Index® highlights continued strength across residential and non-residential construction, while also revealing significant differences between Australia’s major construction markets,” said Oliver Nichols, Rider Levett Bucknall’s Oceania Director of Research and Development.
The national picture
Crane numbers rose 6.7% over the six months to Q3 2026. That net gain of 56 cranes masks considerable churn: 370 cranes went up on major sites during the period and 314 came down. Both sides of the index improved. The residential index climbed from 150 to 166 points, and the non-residential index rose from 323 to 330.
The broader data supports the view that the market’s foundations are solid. ABS figures show construction work reached a record $318 billion in 2025, up 3.8% on 2024. In 2025–26, residential construction grew 8.1%, including a 13.2% lift in apartment and townhouse activity. Non-residential construction rose 9.3%, underpinned by data centres and health, while engineering construction eased 0.6%.
Melbourne sets a new benchmark
Melbourne is the standout growth story of this edition. Its 224 cranes edge past the city’s previous peak of 222, set in Q1 2019, after a net gain of 21 cranes over six months lifted its index to 193 points.
Residential construction did most of the work, adding a net 24 cranes. Residential projects now make up 48% of the city’s cranes, up from 41% in Q1 2026.
Data centre and industrial activity is also expanding rapidly, with 31 cranes now operating, up from 20 in Q1. The pipeline includes the NEXTDC M2 expansion in Tullamarine, LA1 Laverton, STACK Infrastructure’s MEL02 in Truganina and Amazon AWS in Cobblebank.
Transport infrastructure remains a pillar of activity. The North East Link and Suburban Rail Loop together account for 42 cranes, or 19% of the city’s total. Geographically, Melbourne’s North saw the sharpest rise, adding 22 cranes on the back of residential and data centre projects.
Sydney still leads, but residential is cooling
Sydney remains the country’s largest crane market by a wide margin, with more than a third of the national total, but it is moving in the opposite direction to Melbourne. Its crane count fell from 346 to 336 and its index declined from 214 to 207 points.
The softening is concentrated in residential. Residential projects account for 189 cranes, or 56% of Sydney’s total, down from 204 in Q1. Mixed-use and other projects contribute another 91, so residential and mixed-use together still represent 83% of the city’s crane activity.
The decline was uneven. Sydney North contracted the most, falling from 110 to 97 cranes, while Sydney South added six cranes to reach 46 and Sydney Inner edged up to 78. Large projects continue to anchor the market, including Arncliffe Central, The Carling in Carlingford, The Rise in Pemulwuy, the Marsden Park Data Centre, and major developments in the CBD and Parramatta.
South-East Queensland gathers pace
South-East Queensland’s crane count rose from 153 to 178. Brisbane increased from 70 to 80, while the Gold Coast reached a record 82 cranes and continues to outnumber Brisbane.
Residential construction dominates the region. Brisbane’s residential crane count rose from 43 to 54, or 67.5% of the city’s total, and across South-East Queensland residential projects account for 137 cranes, or 77% of all activity. On the Gold Coast, 30 cranes were added and 23 removed. Residential projects make up 88% of the city’s cranes, with the remainder spread across aged care, mixed-use, commercial and data centre/industrial work.
Growth spreads beyond the biggest capitals
One of the clearer signals in this edition is how widely growth has spread.
Perth rose from 40 to 48 cranes, with residential projects accounting for 56% of activity and health construction gaining momentum through the New Women and Babies Hospital and St John of God Oncology Facility. Western Australia recorded 9.0% growth in total construction work in 2025–26, with residential up 11.0%.
Canberra climbed from 22 to 28 cranes. Commercial activity increased to 10 cranes, though residential remains the largest sector. Total ACT construction work rose 5.8% in 2025–26, with engineering construction up 35.7%.
The Sunshine Coast doubled its count from eight to 16, driven by residential development alongside data centre and hotel projects. Wollongong and Shellharbour rose from 25 to 32 cranes, with new activity at Port Kembla’s No. 6 Blast Furnace and the New Shellharbour Hospital.
Adelaide held close to its record at 28 cranes, and Newcastle increased from 10 to 13. Darwin was the notable exception outside Sydney, falling from four long-term cranes to one, with activity now focused on the Darwin Civic Centre.
What it means: a strong pipeline, unevenly distributed
The Q3 2026 index points to a construction market with real depth, particularly across residential, defence, health and data centres. But the national record should not be read as a uniform upswing.
“While residential construction is driving much of the growth in Melbourne and South-East Queensland, Sydney is experiencing a reduction in residential cranes,” Oliver said. “Simultaneously, data centres, health infrastructure, major transport projects and other large-scale developments are providing important sources of activity across several markets.”
Private-sector feasibility and financing constraints are still weighing on some projects. For developers, contractors and investors, the takeaway is that conditions depend heavily on location and sector. A record national count sits alongside pockets of contraction, and the drivers of activity in one city may look quite different from those in the next.
Explore our in-depth analysis and an interactive breakdown of the cranes and projects here.
This article has been republished with permission from Rider Levett Bucknall. Read original.